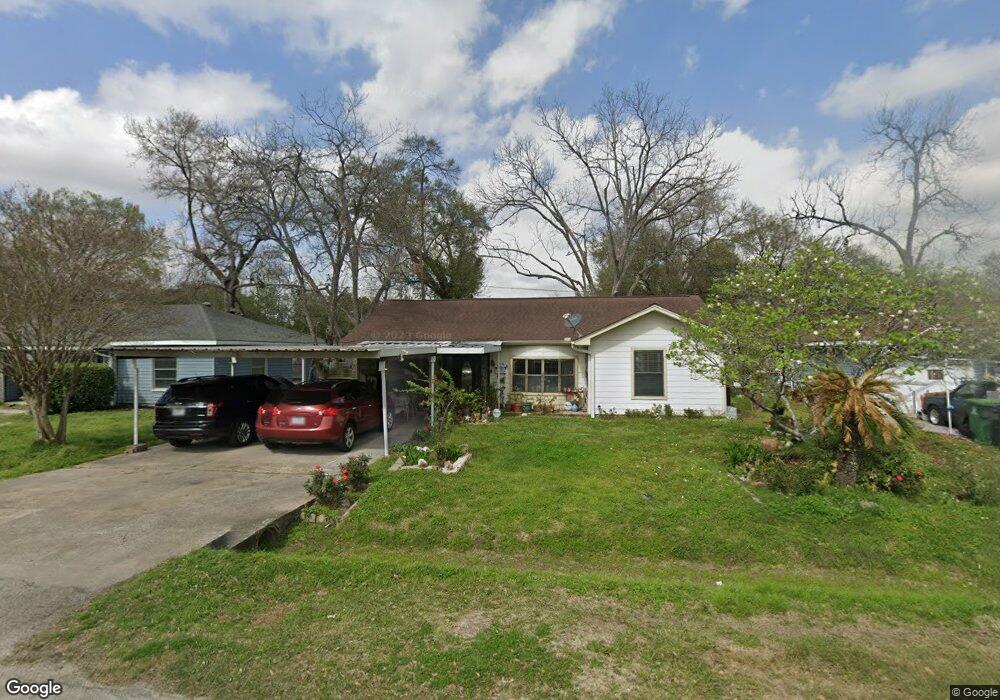
43 Trenwood Ln Houston, TX 77022
Northside-Northline NeighborhoodEstimated Value: $213,627 - $270,000
3
Beds
2
Baths
1,520
Sq Ft
$155/Sq Ft
Est. Value
About This Home
This home is located at 43 Trenwood Ln, Houston, TX 77022 and is currently estimated at $235,157, approximately $154 per square foot. 43 Trenwood Ln is a home located in Harris County with nearby schools including Burbank Elementary School, Burbank Middle School, and Sam Houston Math, Science & Technology Center.
Ownership History
Date
Name
Owned For
Owner Type
Purchase Details
Closed on
Sep 27, 1993
Sold by
Doyle Charles R
Bought by
Gonzales Sam S and Gonzales Dora
Current Estimated Value
Home Financials for this Owner
Home Financials are based on the most recent Mortgage that was taken out on this home.
Original Mortgage
$29,000
Interest Rate
7.11%
Mortgage Type
Seller Take Back
Create a Home Valuation Report for This Property
The Home Valuation Report is an in-depth analysis detailing your home's value as well as a comparison with similar homes in the area
Home Values in the Area
Average Home Value in this Area
Purchase History
| Date | Buyer | Sale Price | Title Company |
|---|---|---|---|
| Gonzales Sam S | -- | Texas American Title Company |
Source: Public Records
Mortgage History
| Date | Status | Borrower | Loan Amount |
|---|---|---|---|
| Closed | Gonzales Sam S | $29,000 |
Source: Public Records
Tax History Compared to Growth
Tax History
| Year | Tax Paid | Tax Assessment Tax Assessment Total Assessment is a certain percentage of the fair market value that is determined by local assessors to be the total taxable value of land and additions on the property. | Land | Improvement |
|---|---|---|---|---|
| 2025 | $2,577 | $196,202 | $62,948 | $133,254 |
| 2024 | $2,577 | $199,411 | $62,948 | $136,463 |
| 2023 | $2,577 | $178,179 | $62,948 | $115,231 |
| 2022 | $2,560 | $143,910 | $47,960 | $95,950 |
| 2021 | $2,463 | $129,772 | $47,960 | $81,812 |
| 2020 | $2,327 | $109,952 | $47,960 | $61,992 |
| 2019 | $2,210 | $95,053 | $31,474 | $63,579 |
| 2018 | $0 | $79,413 | $31,474 | $47,939 |
| 2017 | $2,008 | $79,413 | $31,474 | $47,939 |
| 2016 | $1,950 | $77,102 | $31,474 | $45,628 |
| 2015 | $84 | $72,537 | $31,474 | $41,063 |
| 2014 | $84 | $72,537 | $31,474 | $41,063 |
Source: Public Records
Map
Nearby Homes
- 44 Farrell St
- 45 Wellford St
- 61 Trenwood Ln
- 56 Wellford St
- 70 Burress St
- 90 Burress St Unit B
- 90 Burress St Unit A
- Cypress Plan at Wellford Village
- Willow Plan at Wellford Village
- 108 Fichter St
- 132 Grothe Ln
- 216 Burress St
- 249 De Boll St
- 253 De Boll St
- 9625 Fulton St
- 91 Burbank St
- 0 Burbank St Unit 9886770
- 119 Rebecca St
- 104 Luetta St
- 106 Luetta St