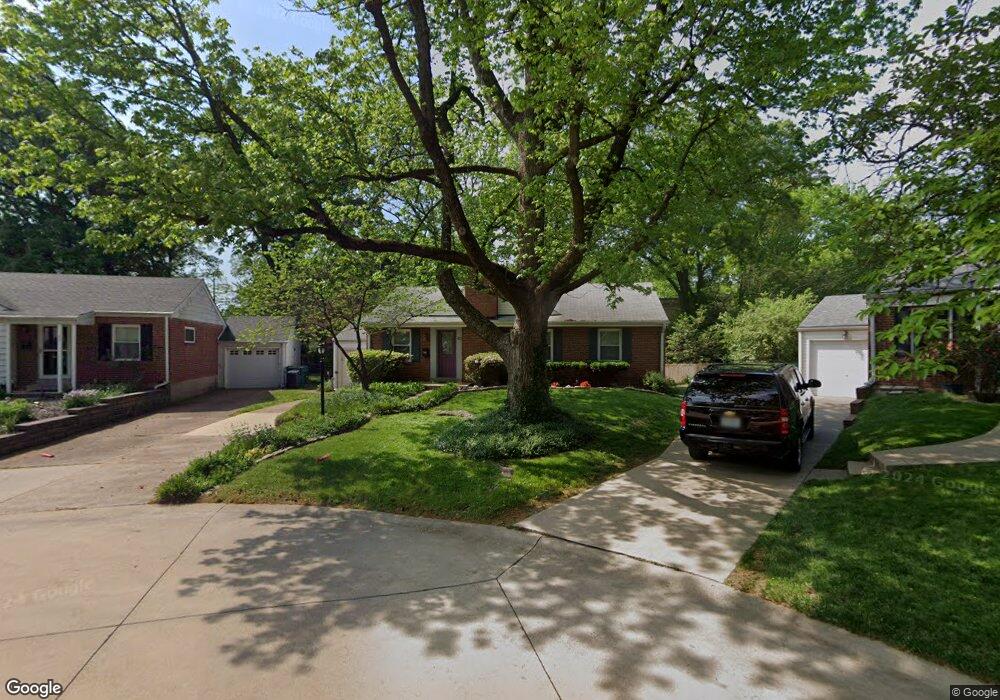
43 Turf Ct Saint Louis, MO 63119
Estimated Value: $356,000 - $394,000
3
Beds
2
Baths
1,102
Sq Ft
$334/Sq Ft
Est. Value
About This Home
This home is located at 43 Turf Ct, Saint Louis, MO 63119 and is currently estimated at $368,450, approximately $334 per square foot. 43 Turf Ct is a home located in St. Louis County with nearby schools including Clark Elementary School, Hixson Middle School, and Webster Groves High School.
Ownership History
Date
Name
Owned For
Owner Type
Purchase Details
Closed on
Nov 22, 2004
Sold by
Stein Korte Leslie W and Korte Kevin B
Bought by
Primacy Closing Corp
Current Estimated Value
Home Financials for this Owner
Home Financials are based on the most recent Mortgage that was taken out on this home.
Original Mortgage
$131,200
Outstanding Balance
$63,956
Interest Rate
5.64%
Mortgage Type
Purchase Money Mortgage
Estimated Equity
$304,494
Purchase Details
Closed on
Oct 28, 2004
Sold by
Primacy Closing Corp
Bought by
Radcliffe Anita M
Home Financials for this Owner
Home Financials are based on the most recent Mortgage that was taken out on this home.
Original Mortgage
$131,200
Outstanding Balance
$63,956
Interest Rate
5.64%
Mortgage Type
Purchase Money Mortgage
Estimated Equity
$304,494
Purchase Details
Closed on
Mar 26, 1999
Sold by
Leslie Stein and Leslie W
Bought by
Korte Kevin B and Stein Korte Leslie W
Home Financials for this Owner
Home Financials are based on the most recent Mortgage that was taken out on this home.
Original Mortgage
$86,000
Interest Rate
6.82%
Create a Home Valuation Report for This Property
The Home Valuation Report is an in-depth analysis detailing your home's value as well as a comparison with similar homes in the area
Home Values in the Area
Average Home Value in this Area
Purchase History
| Date | Buyer | Sale Price | Title Company |
|---|---|---|---|
| Primacy Closing Corp | -- | -- | |
| Radcliffe Anita M | $164,000 | -- | |
| Korte Kevin B | -- | Capital Title |
Source: Public Records
Mortgage History
| Date | Status | Borrower | Loan Amount |
|---|---|---|---|
| Open | Radcliffe Anita M | $131,200 | |
| Previous Owner | Korte Kevin B | $86,000 | |
| Closed | Radcliffe Anita M | $24,600 |
Source: Public Records
Tax History Compared to Growth
Tax History
| Year | Tax Paid | Tax Assessment Tax Assessment Total Assessment is a certain percentage of the fair market value that is determined by local assessors to be the total taxable value of land and additions on the property. | Land | Improvement |
|---|---|---|---|---|
| 2025 | $3,871 | $59,510 | $34,810 | $24,700 |
| 2024 | $3,871 | $55,540 | $24,740 | $30,800 |
| 2023 | $3,871 | $55,540 | $24,740 | $30,800 |
| 2022 | $3,504 | $46,850 | $21,660 | $25,190 |
| 2021 | $3,492 | $46,850 | $21,660 | $25,190 |
| 2020 | $3,407 | $42,560 | $21,660 | $20,900 |
| 2019 | $3,388 | $42,560 | $21,660 | $20,900 |
| 2018 | $3,325 | $37,090 | $15,470 | $21,620 |
| 2017 | $3,303 | $37,090 | $15,470 | $21,620 |
| 2016 | $3,145 | $33,820 | $11,590 | $22,230 |
| 2015 | $3,150 | $33,820 | $11,590 | $22,230 |
| 2014 | $3,207 | $33,510 | $10,410 | $23,100 |
Source: Public Records
Map
Nearby Homes
- 134 Firwood Dr
- 26 Webster Oaks Dr
- 30 Webster Oaks Dr
- 147 Firwood Dr
- 107 Saint George Place
- 1509 Holly Dr
- 1330 Drayton Ave
- 432 Reavis Place Unit 20
- 1139 Hawken Place Unit 6
- 1316 Webster Forest Ct
- 1515 Bridle Rd
- 308 Oak Tree Dr
- 312 Oak Tree Dr
- 1353 Webster Path Dr
- 614 Conover Ln
- 514 S Gore Ave
- 127 Webster Woods Dr
- 631 Clover Ln
- 640 Clover Ln
- 725 Brookridge Dr