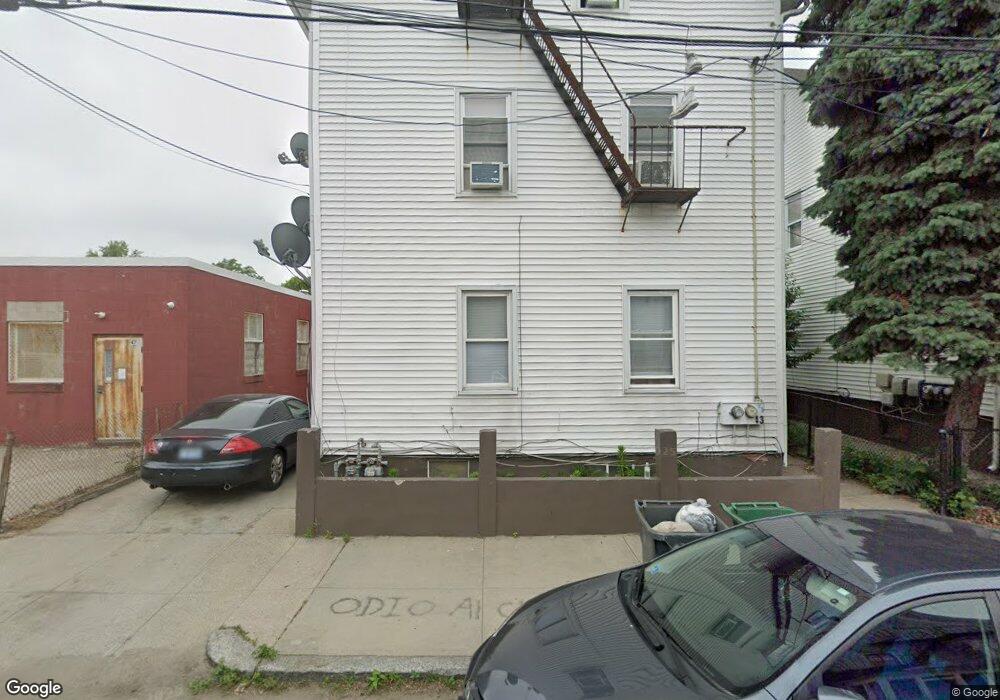
43 Tuxedo Ave Providence, RI 02909
Olneyville NeighborhoodEstimated Value: $499,000 - $572,000
7
Beds
4
Baths
2,400
Sq Ft
$226/Sq Ft
Est. Value
About This Home
This home is located at 43 Tuxedo Ave, Providence, RI 02909 and is currently estimated at $542,667, approximately $226 per square foot. 43 Tuxedo Ave is a home located in Providence County with nearby schools including Asa Messer Elementary School, Charles N. Fortes Elementary School, and Laurel Hill Annex School.
Ownership History
Date
Name
Owned For
Owner Type
Purchase Details
Closed on
Aug 2, 2012
Sold by
Nelken Beata
Bought by
Rockingham Assoc Llc
Current Estimated Value
Home Financials for this Owner
Home Financials are based on the most recent Mortgage that was taken out on this home.
Original Mortgage
$40,000
Interest Rate
3.74%
Mortgage Type
New Conventional
Purchase Details
Closed on
Jul 27, 2012
Sold by
Torres Argentina and Murillo Samuel
Bought by
Nelken Beata
Home Financials for this Owner
Home Financials are based on the most recent Mortgage that was taken out on this home.
Original Mortgage
$40,000
Interest Rate
3.74%
Mortgage Type
New Conventional
Purchase Details
Closed on
Feb 10, 2004
Sold by
Miele Frank S
Bought by
Murrillo Samuel
Purchase Details
Closed on
May 9, 2003
Sold by
Martinelli Amelia L
Bought by
Forefront
Create a Home Valuation Report for This Property
The Home Valuation Report is an in-depth analysis detailing your home's value as well as a comparison with similar homes in the area
Home Values in the Area
Average Home Value in this Area
Purchase History
| Date | Buyer | Sale Price | Title Company |
|---|---|---|---|
| Rockingham Assoc Llc | -- | -- | |
| Nelken Beata | $50,000 | -- | |
| Murrillo Samuel | $190,000 | -- | |
| Forefront | $72,500 | -- |
Source: Public Records
Mortgage History
| Date | Status | Borrower | Loan Amount |
|---|---|---|---|
| Closed | Forefront | $69,601 | |
| Closed | Forefront | $40,000 | |
| Previous Owner | Forefront | $10,000 | |
| Previous Owner | Forefront | $11,000 |
Source: Public Records
Tax History Compared to Growth
Tax History
| Year | Tax Paid | Tax Assessment Tax Assessment Total Assessment is a certain percentage of the fair market value that is determined by local assessors to be the total taxable value of land and additions on the property. | Land | Improvement |
|---|---|---|---|---|
| 2025 | $5,851 | $417,900 | $139,300 | $278,600 |
| 2024 | $5,144 | $280,300 | $91,500 | $188,800 |
| 2023 | $5,144 | $280,300 | $91,500 | $188,800 |
| 2022 | $4,989 | $280,300 | $91,500 | $188,800 |
| 2021 | $3,748 | $152,600 | $42,500 | $110,100 |
| 2020 | $3,748 | $152,600 | $42,500 | $110,100 |
| 2019 | $3,748 | $152,600 | $42,500 | $110,100 |
| 2018 | $3,580 | $112,000 | $44,100 | $67,900 |
| 2017 | $3,580 | $112,000 | $44,100 | $67,900 |
| 2016 | $3,580 | $112,000 | $44,100 | $67,900 |
| 2015 | $3,231 | $97,600 | $44,100 | $53,500 |
| 2014 | $3,294 | $97,600 | $44,100 | $53,500 |
| 2013 | $3,294 | $97,600 | $44,100 | $53,500 |
Source: Public Records
Map
Nearby Homes