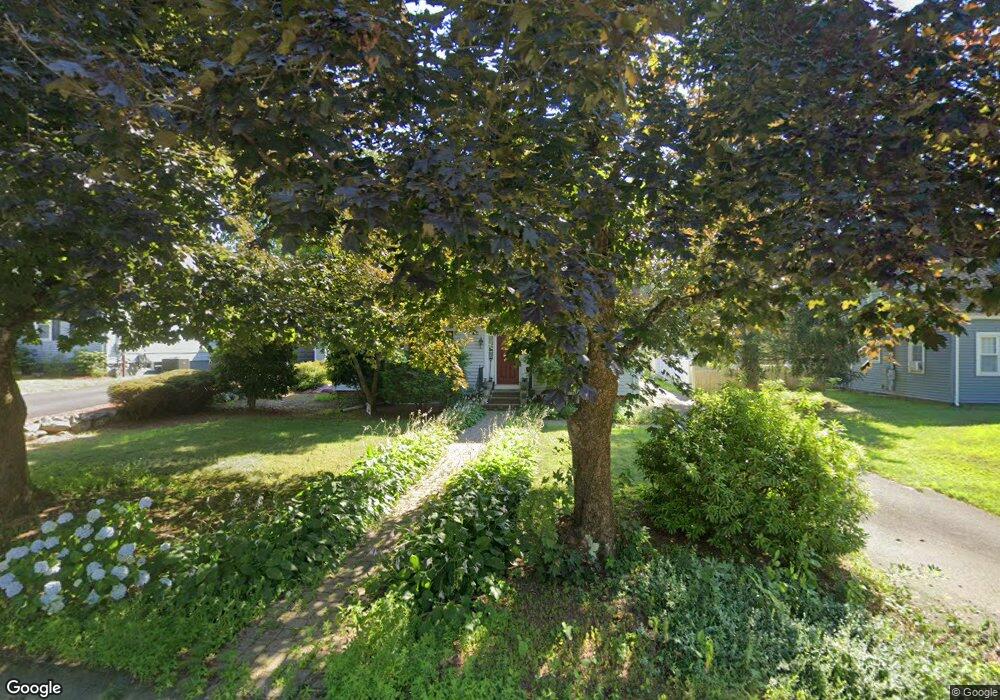
43 Tyler St Attleboro, MA 02703
Estimated Value: $534,614 - $624,000
3
Beds
2
Baths
1,972
Sq Ft
$288/Sq Ft
Est. Value
About This Home
This home is located at 43 Tyler St, Attleboro, MA 02703 and is currently estimated at $567,654, approximately $287 per square foot. 43 Tyler St is a home located in Bristol County with nearby schools including Peter Thacher Elementary School, Wamsutta Middle School, and Attleboro High School.
Ownership History
Date
Name
Owned For
Owner Type
Purchase Details
Closed on
Jul 31, 1996
Sold by
Chemical Bk
Bought by
Madigan Phyllis M
Current Estimated Value
Home Financials for this Owner
Home Financials are based on the most recent Mortgage that was taken out on this home.
Original Mortgage
$128,630
Outstanding Balance
$10,222
Interest Rate
8.27%
Mortgage Type
Purchase Money Mortgage
Estimated Equity
$557,432
Purchase Details
Closed on
Jul 24, 1996
Sold by
Morgan James P and Chemical Bk
Bought by
Chemical Bk
Home Financials for this Owner
Home Financials are based on the most recent Mortgage that was taken out on this home.
Original Mortgage
$128,630
Outstanding Balance
$10,222
Interest Rate
8.27%
Mortgage Type
Purchase Money Mortgage
Estimated Equity
$557,432
Create a Home Valuation Report for This Property
The Home Valuation Report is an in-depth analysis detailing your home's value as well as a comparison with similar homes in the area
Home Values in the Area
Average Home Value in this Area
Purchase History
| Date | Buyer | Sale Price | Title Company |
|---|---|---|---|
| Madigan Phyllis M | $129,000 | -- | |
| Chemical Bk | $61,740 | -- |
Source: Public Records
Mortgage History
| Date | Status | Borrower | Loan Amount |
|---|---|---|---|
| Open | Chemical Bk | $128,630 | |
| Previous Owner | Chemical Bk | $55,000 | |
| Previous Owner | Chemical Bk | $32,000 |
Source: Public Records
Tax History Compared to Growth
Tax History
| Year | Tax Paid | Tax Assessment Tax Assessment Total Assessment is a certain percentage of the fair market value that is determined by local assessors to be the total taxable value of land and additions on the property. | Land | Improvement |
|---|---|---|---|---|
| 2025 | $5,233 | $417,000 | $127,400 | $289,600 |
| 2024 | $5,167 | $405,900 | $127,400 | $278,500 |
| 2023 | $4,537 | $331,400 | $115,800 | $215,600 |
| 2022 | $4,461 | $308,700 | $110,300 | $198,400 |
| 2021 | $4 | $285,100 | $106,000 | $179,100 |
| 2020 | $4,148 | $284,900 | $103,000 | $181,900 |
| 2019 | $3,820 | $269,800 | $101,000 | $168,800 |
| 2018 | $4 | $267,800 | $98,000 | $169,800 |
| 2017 | $0 | $253,900 | $98,000 | $155,900 |
| 2016 | $3,884 | $262,100 | $96,200 | $165,900 |
| 2015 | $3,891 | $264,500 | $96,200 | $168,300 |
| 2014 | $3,715 | $250,200 | $91,600 | $158,600 |
Source: Public Records
Map
Nearby Homes
- 429 S Main St Unit 1
- 75 Grant St
- 3 Dailey St Unit J
- 3 Grant St
- 172 Downing Dr
- 115 Ellis St
- 0 Tulip Unit 73410552
- 0 Tulip Unit 73407296
- 26 Lamb St
- 248 S Main St
- 309 Thacher St
- 63 Orange St
- 52 Orange St
- 44 Mulberry St
- 73 Valley Run Dr
- 62 Garden St Unit 3
- 804 County St
- 24 Oakland Ave Unit 1
- 22 Oakland Ave Unit 1
- 599 Oakhill Ave