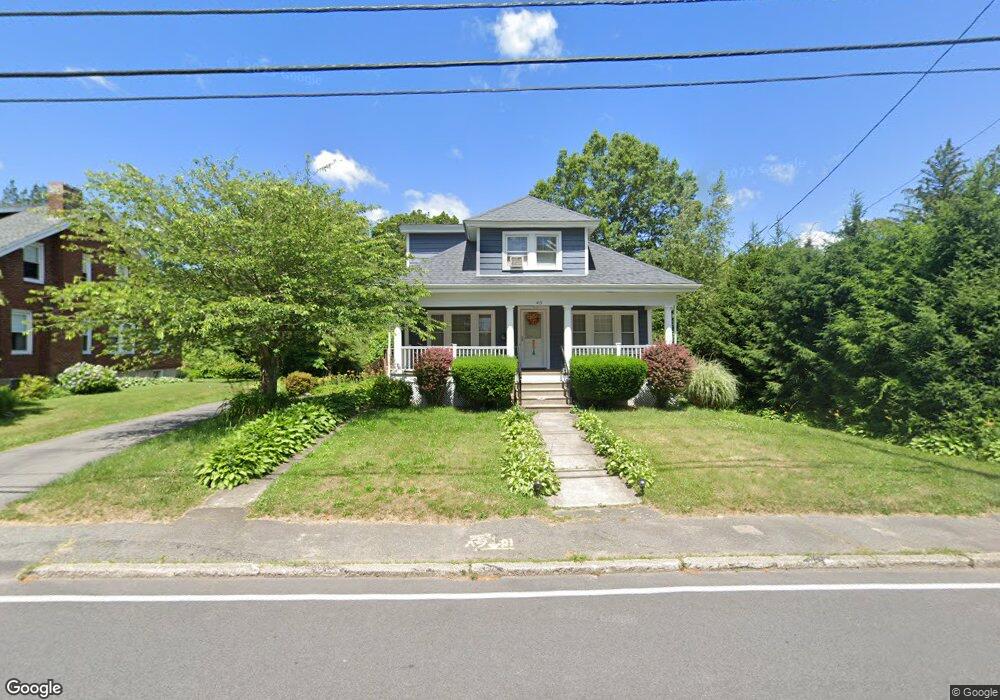
43 Union St Bridgewater, MA 02324
Estimated Value: $570,934 - $625,000
4
Beds
2
Baths
1,820
Sq Ft
$327/Sq Ft
Est. Value
About This Home
This home is located at 43 Union St, Bridgewater, MA 02324 and is currently estimated at $594,234, approximately $326 per square foot. 43 Union St is a home located in Plymouth County with nearby schools including Mitchell Elementary School, Williams Intermediate School, and Bridgewater Middle School.
Ownership History
Date
Name
Owned For
Owner Type
Purchase Details
Closed on
Sep 28, 2001
Sold by
Hatch William A and Hatch Jeannine M
Bought by
Burke Kevin M and Burke Valerie A
Current Estimated Value
Home Financials for this Owner
Home Financials are based on the most recent Mortgage that was taken out on this home.
Original Mortgage
$199,900
Outstanding Balance
$78,362
Interest Rate
6.91%
Mortgage Type
Purchase Money Mortgage
Estimated Equity
$515,872
Purchase Details
Closed on
Nov 28, 1990
Sold by
Zahr Robert A
Bought by
Hatch William A
Create a Home Valuation Report for This Property
The Home Valuation Report is an in-depth analysis detailing your home's value as well as a comparison with similar homes in the area
Home Values in the Area
Average Home Value in this Area
Purchase History
| Date | Buyer | Sale Price | Title Company |
|---|---|---|---|
| Burke Kevin M | $249,900 | -- | |
| Hatch William A | $126,000 | -- |
Source: Public Records
Mortgage History
| Date | Status | Borrower | Loan Amount |
|---|---|---|---|
| Open | Hatch William A | $30,000 | |
| Open | Hatch William A | $199,900 | |
| Closed | Hatch William A | $25,000 | |
| Previous Owner | Hatch William A | $118,000 |
Source: Public Records
Tax History
| Year | Tax Paid | Tax Assessment Tax Assessment Total Assessment is a certain percentage of the fair market value that is determined by local assessors to be the total taxable value of land and additions on the property. | Land | Improvement |
|---|---|---|---|---|
| 2025 | $5,480 | $463,200 | $193,700 | $269,500 |
| 2024 | $5,272 | $434,300 | $184,400 | $249,900 |
| 2023 | $5,216 | $406,200 | $172,400 | $233,800 |
| 2022 | $5,108 | $356,700 | $151,200 | $205,500 |
| 2021 | $4,612 | $318,500 | $135,000 | $183,500 |
| 2020 | $4,550 | $308,900 | $129,800 | $179,100 |
| 2019 | $4,458 | $300,600 | $129,800 | $170,800 |
| 2018 | $4,192 | $276,000 | $120,100 | $155,900 |
| 2017 | $4,051 | $259,500 | $120,100 | $139,400 |
| 2016 | $3,885 | $250,000 | $117,700 | $132,300 |
| 2015 | $3,886 | $239,300 | $114,300 | $125,000 |
| 2014 | $3,777 | $232,400 | $110,900 | $121,500 |
Source: Public Records
Map
Nearby Homes
- 180 Main St Unit D80
- 180 Main St Unit 1109
- 180 Main St Unit A15
- 180 Main St Unit 4105
- 47 Hale St
- 5 Heather Ln
- 130 Maple Ave
- 167 Spring St
- 51 Cottage St
- 302 Pleasant St
- 35 Leonard St Unit 3
- 220 Bedford St Unit 32
- 459 High St
- 48 Wall St
- Lot 2 Fontana Way
- 580 Broad St Unit 2
- 580 Broad St Unit 1
- 54 Michael Rd Unit 33
- 8 North St
- 35 Nelson Dr
Your Personal Tour Guide
Ask me questions while you tour the home.