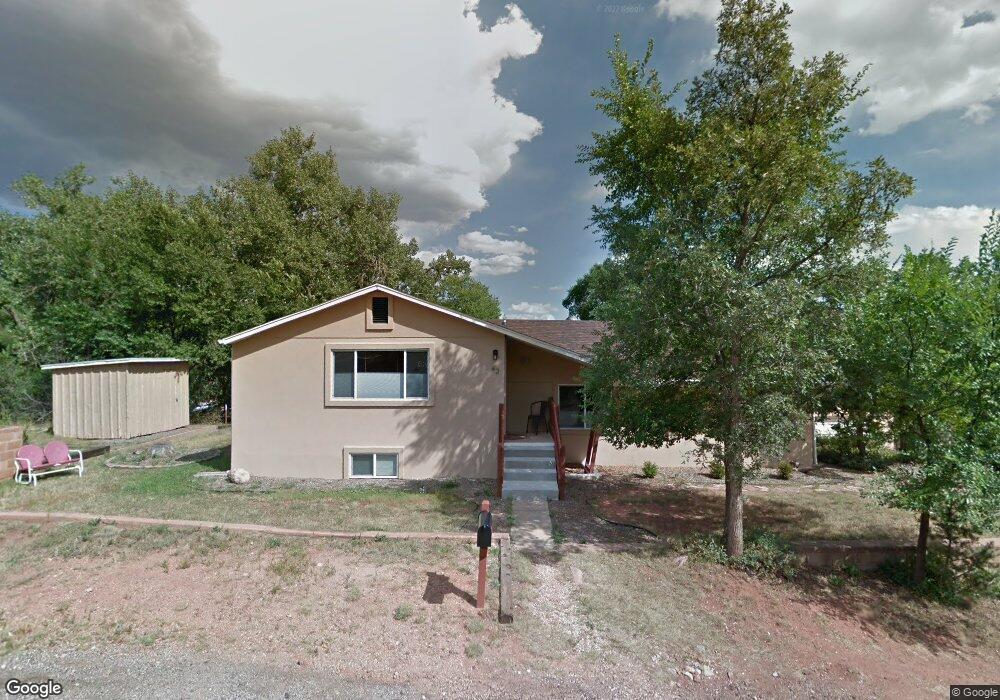
43 Via Chula Vista Manitou Springs, CO 80829
Garden of the Gods NeighborhoodEstimated Value: $573,000 - $746,000
3
Beds
2
Baths
1,602
Sq Ft
$398/Sq Ft
Est. Value
About This Home
This home is located at 43 Via Chula Vista, Manitou Springs, CO 80829 and is currently estimated at $637,060, approximately $397 per square foot. 43 Via Chula Vista is a home located in El Paso County with nearby schools including Manitou Springs Elementary School, Manitou Springs Middle School, and Manitou Springs High School.
Ownership History
Date
Name
Owned For
Owner Type
Purchase Details
Closed on
Sep 25, 2023
Sold by
Dunn Thomas Le and Dunn Carolan
Bought by
Dunn Thomas E and Dunn Carolan K
Current Estimated Value
Purchase Details
Closed on
Jul 23, 2014
Sold by
Halstead Janice R
Bought by
Dunn Thomas and Dunn Carolan
Home Financials for this Owner
Home Financials are based on the most recent Mortgage that was taken out on this home.
Original Mortgage
$257,600
Interest Rate
4.23%
Mortgage Type
New Conventional
Purchase Details
Closed on
Nov 26, 2013
Sold by
Whittenbeck Eileen
Bought by
Halstead Janice R
Home Financials for this Owner
Home Financials are based on the most recent Mortgage that was taken out on this home.
Original Mortgage
$133,000
Interest Rate
4.34%
Mortgage Type
Unknown
Purchase Details
Closed on
May 1, 1991
Bought by
Dunn Thomas
Create a Home Valuation Report for This Property
The Home Valuation Report is an in-depth analysis detailing your home's value as well as a comparison with similar homes in the area
Home Values in the Area
Average Home Value in this Area
Purchase History
| Date | Buyer | Sale Price | Title Company |
|---|---|---|---|
| Dunn Thomas E | -- | None Listed On Document | |
| Dunn Thomas | $325,000 | Empire Title Co Springs Llc | |
| Halstead Janice R | $190,000 | Empire Title Co Springs Llc | |
| Dunn Thomas | -- | -- |
Source: Public Records
Mortgage History
| Date | Status | Borrower | Loan Amount |
|---|---|---|---|
| Previous Owner | Dunn Thomas | $257,600 | |
| Previous Owner | Halstead Janice R | $133,000 |
Source: Public Records
Tax History Compared to Growth
Tax History
| Year | Tax Paid | Tax Assessment Tax Assessment Total Assessment is a certain percentage of the fair market value that is determined by local assessors to be the total taxable value of land and additions on the property. | Land | Improvement |
|---|---|---|---|---|
| 2025 | $2,856 | $44,770 | -- | -- |
| 2024 | $2,647 | $42,440 | $8,710 | $33,730 |
| 2023 | $2,647 | $42,440 | $8,710 | $33,730 |
| 2022 | $2,281 | $30,860 | $6,950 | $23,910 |
| 2021 | $2,378 | $31,750 | $7,150 | $24,600 |
| 2020 | $2,241 | $28,500 | $7,150 | $21,350 |
| 2019 | $2,380 | $28,500 | $7,150 | $21,350 |
| 2018 | $2,211 | $25,130 | $5,540 | $19,590 |
| 2017 | $1,955 | $25,130 | $5,540 | $19,590 |
| 2016 | $1,833 | $23,560 | $5,570 | $17,990 |
| 2015 | $1,812 | $23,560 | $5,570 | $17,990 |
| 2014 | $1,419 | $19,610 | $5,570 | $14,040 |
Source: Public Records
Map
Nearby Homes
- 101 Beckers Ln
- 121 Via San Miguel
- 7 Escondido Valle
- 52 El Paso Blvd Unit 1C
- 154 El Paso Blvd
- 0 El Paso Blvd Unit REC3533719
- 0 El Paso Blvd
- 503 Columbia Rd
- 3725 Saints Ct
- 144 Crystal Park Rd
- 107 Oak Place
- 607 Columbia Ct
- 322 Santa fe Place Unit B
- 18 Taos Place Unit 18
- 0 Clarksley Rd
- 223 Crystal Hills Blvd
- 133 Yale Ave
- 3408 W Pikes Peak Ave
- 427 Bond St
- 3335 W Pikes Peak Ave
- 123 Beckers Ln
- 125 Beckers Ln
- 114 Via San Miguel
- 41 Via Chula Vista
- 203 Beckers Ln
- 115 Beckers Ln
- 42 Via Chula Vista
- 118 Via San Miguel
- 105 Beckers Ln
- 113 Beckers Ln
- 107 Beckers Ln
- 109 Beckers Ln
- 40 Via Chula Vista
- 111 Beckers Ln
- 205 Beckers Ln
- 207 Beckers Ln
- 103 Beckers Ln
- 115 Via San Miguel
- 117 Vía San Miguel
- 35 Via Chula Vista