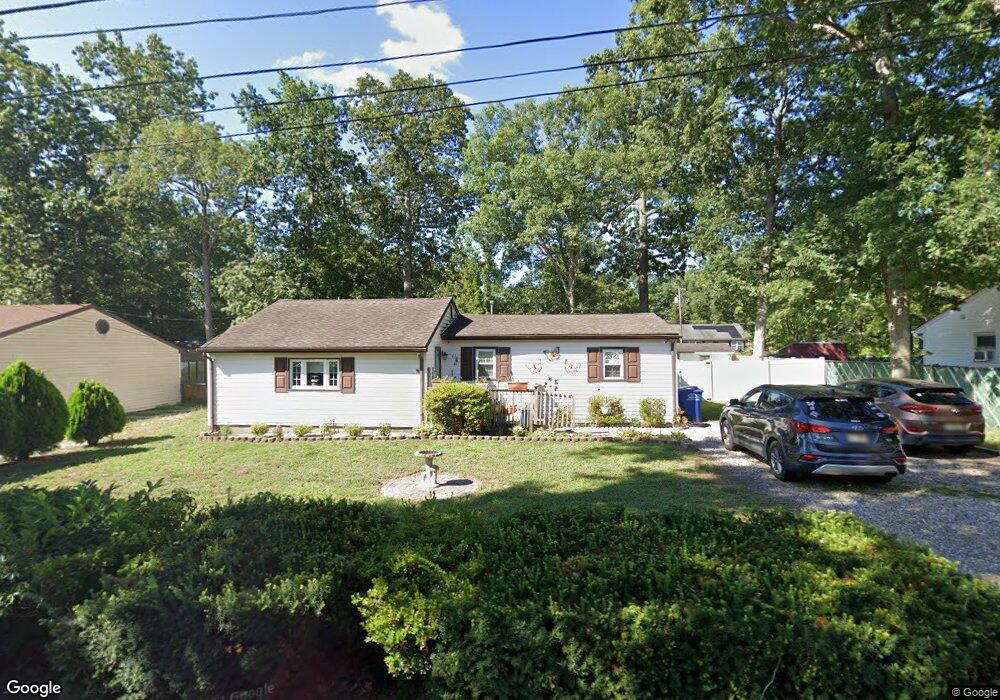
43 Violet St Browns Mills, NJ 08015
Estimated Value: $202,000 - $304,000
2
Beds
1
Bath
1,140
Sq Ft
$230/Sq Ft
Est. Value
About This Home
This home is located at 43 Violet St, Browns Mills, NJ 08015 and is currently estimated at $261,792, approximately $229 per square foot. 43 Violet St is a home located in Burlington County.
Ownership History
Date
Name
Owned For
Owner Type
Purchase Details
Closed on
Mar 27, 2009
Sold by
Brown Ronald L and Brown Deborah
Bought by
Klingerman Joshua R and Klingerman Ginette K
Current Estimated Value
Home Financials for this Owner
Home Financials are based on the most recent Mortgage that was taken out on this home.
Original Mortgage
$94,653
Outstanding Balance
$59,578
Interest Rate
4.94%
Mortgage Type
FHA
Estimated Equity
$202,214
Purchase Details
Closed on
Mar 18, 2009
Sold by
Deutsche Bank National Trust Company
Bought by
Brown Ii Ronald L
Home Financials for this Owner
Home Financials are based on the most recent Mortgage that was taken out on this home.
Original Mortgage
$94,653
Outstanding Balance
$59,578
Interest Rate
4.94%
Mortgage Type
FHA
Estimated Equity
$202,214
Create a Home Valuation Report for This Property
The Home Valuation Report is an in-depth analysis detailing your home's value as well as a comparison with similar homes in the area
Home Values in the Area
Average Home Value in this Area
Purchase History
| Date | Buyer | Sale Price | Title Company |
|---|---|---|---|
| Klingerman Joshua R | $96,400 | None Available | |
| Brown Ii Ronald L | $43,007 | None Available |
Source: Public Records
Mortgage History
| Date | Status | Borrower | Loan Amount |
|---|---|---|---|
| Open | Brown Ii Ronald L | $94,653 |
Source: Public Records
Tax History Compared to Growth
Tax History
| Year | Tax Paid | Tax Assessment Tax Assessment Total Assessment is a certain percentage of the fair market value that is determined by local assessors to be the total taxable value of land and additions on the property. | Land | Improvement |
|---|---|---|---|---|
| 2025 | $4,208 | $137,300 | $38,000 | $99,300 |
| 2024 | $3,949 | $137,300 | $38,000 | $99,300 |
| 2023 | $3,949 | $137,300 | $38,000 | $99,300 |
| 2022 | $3,655 | $137,300 | $38,000 | $99,300 |
| 2021 | $3,505 | $137,300 | $38,000 | $99,300 |
| 2020 | $3,373 | $137,300 | $38,000 | $99,300 |
| 2019 | $3,231 | $137,300 | $38,000 | $99,300 |
| 2018 | $3,121 | $137,300 | $38,000 | $99,300 |
| 2017 | $3,056 | $137,300 | $38,000 | $99,300 |
| 2016 | $2,594 | $69,400 | $19,600 | $49,800 |
| 2015 | $2,573 | $69,400 | $19,600 | $49,800 |
| 2014 | $2,460 | $69,400 | $19,600 | $49,800 |
Source: Public Records
Map
Nearby Homes