Estimated Value: $218,000 - $445,315
Studio
--
Bath
--
Sq Ft
10,019
Sq Ft Lot
About This Home
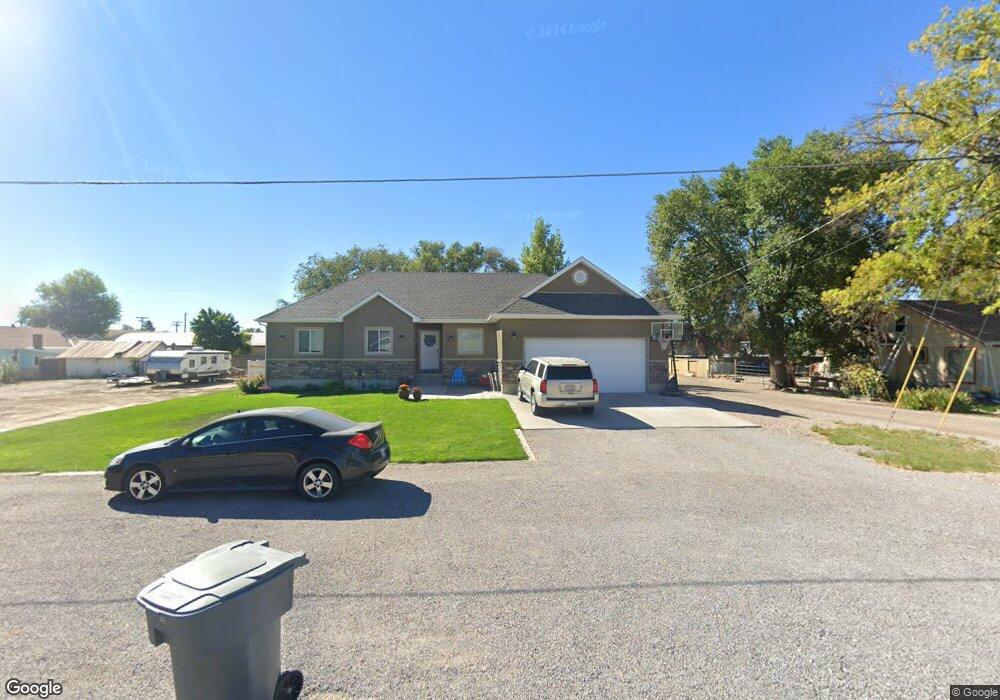
This home is located at 43 W 100 N, Delta, UT 84624 and is currently estimated at $343,772. 43 W 100 N is a home with nearby schools including Cba Center and White River Academy.
Ownership History
Date
Name
Owned For
Owner Type
Purchase Details
Closed on
Aug 12, 2016
Sold by
Morris Kory and Morris Jenny
Bought by
Larsen Steven R and Larsen Lesli J
Current Estimated Value
Home Financials for this Owner
Home Financials are based on the most recent Mortgage that was taken out on this home.
Original Mortgage
$185,000
Outstanding Balance
$147,208
Interest Rate
3.48%
Mortgage Type
New Conventional
Estimated Equity
$196,564
Purchase Details
Closed on
Feb 8, 2011
Sold by
Rayola Residential Properties Lc
Bought by
Morris Kory and Morris Jenny
Home Financials for this Owner
Home Financials are based on the most recent Mortgage that was taken out on this home.
Original Mortgage
$170,436
Interest Rate
4.67%
Purchase Details
Closed on
Aug 3, 2009
Sold by
Tolley Rayola P
Bought by
Rayola Residential Properties Lc
Purchase Details
Closed on
Jun 22, 2009
Sold by
Tolley Rayola P
Bought by
Rayola Residential Properties Lc
Create a Home Valuation Report for This Property
The Home Valuation Report is an in-depth analysis detailing your home's value as well as a comparison with similar homes in the area
Home Values in the Area
Average Home Value in this Area
Purchase History
| Date | Buyer | Sale Price | Title Company |
|---|---|---|---|
| Larsen Steven R | -- | First American Title | |
| Morris Kory | -- | -- | |
| Rayola Residential Properties Lc | -- | -- | |
| Rayola Residential Properties Lc | -- | -- |
Source: Public Records
Mortgage History
| Date | Status | Borrower | Loan Amount |
|---|---|---|---|
| Open | Larsen Steven R | $185,000 | |
| Previous Owner | Morris Kory | $170,436 |
Source: Public Records
Tax History
| Year | Tax Paid | Tax Assessment Tax Assessment Total Assessment is a certain percentage of the fair market value that is determined by local assessors to be the total taxable value of land and additions on the property. | Land | Improvement |
|---|---|---|---|---|
| 2025 | $2,831 | $302,914 | $16,211 | $286,703 |
| 2024 | $2,831 | $245,218 | $12,269 | $232,949 |
| 2023 | $3,004 | $245,218 | $12,269 | $232,949 |
| 2022 | $2,325 | $174,984 | $12,826 | $162,158 |
| 2021 | $1,977 | $142,071 | $9,698 | $132,373 |
| 2020 | $1,842 | $131,539 | $8,817 | $122,722 |
| 2019 | $1,791 | $128,031 | $8,164 | $119,867 |
| 2018 | $1,639 | $118,134 | $8,164 | $109,970 |
| 2017 | $1,698 | $117,896 | $7,926 | $109,970 |
| 2016 | $1,369 | $97,984 | $7,926 | $90,058 |
| 2015 | $1,368 | $97,984 | $7,926 | $90,058 |
| 2014 | -- | $93,087 | $7,941 | $85,146 |
| 2013 | -- | $93,087 | $7,941 | $85,146 |
Source: Public Records
Map
Nearby Homes
- 149 N 200 W
- 163 W 100 S
- 325 N 100 W
- 0 E Highway 6 Unit LotWP001 16586023
- 44 E 300 S
- 341 W 100 S
- 87 S 300 East Rd
- 435 W 100 S
- 294 S 300 W
- 321 E 200 S
- 451 W 300 N
- 320 N 450 W
- 334 N 450 W
- 445 Topaz Blvd Unit 10
- 520 E 450 North Rd
- 628 Sunset St
- 648 Tamarix St
- 98 W 1000 N
- 901 E 750 Rd N
- Locust Ave Unit LotWP001
Your Personal Tour Guide
Ask me questions while you tour the home.