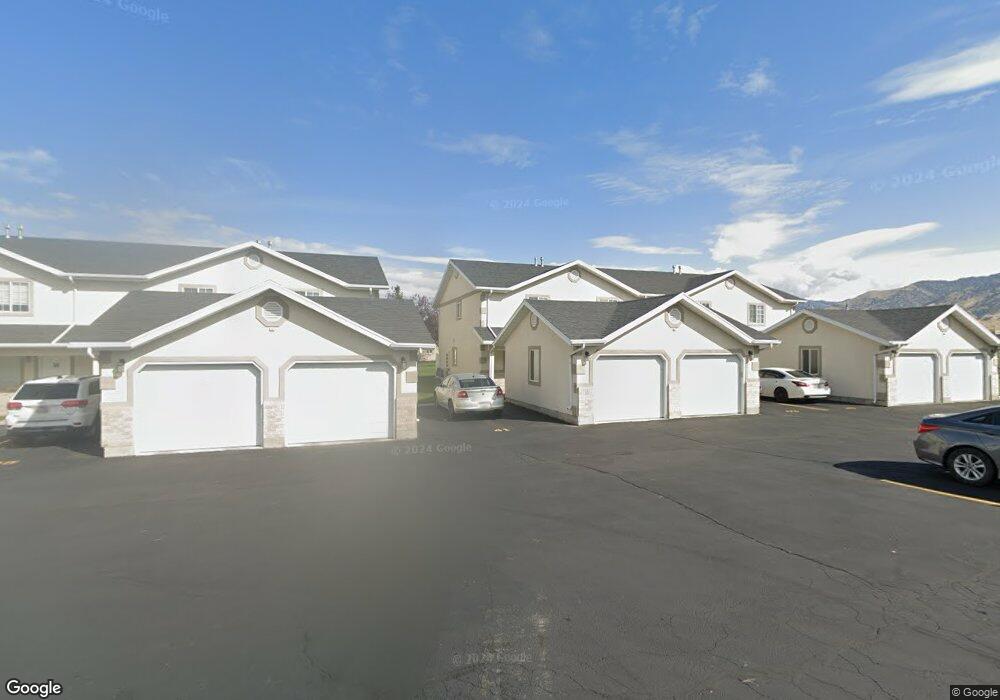
43 W 1315 S Logan, UT 84321
Woodruff NeighborhoodEstimated Value: $257,000 - $267,000
Studio
--
Bath
1,190
Sq Ft
$220/Sq Ft
Est. Value
About This Home
This home is located at 43 W 1315 S, Logan, UT 84321 and is currently estimated at $262,306, approximately $220 per square foot. 43 W 1315 S is a home with nearby schools including Hillcrest Elementary School, Mount Logan Middle School, and Logan High School.
Ownership History
Date
Name
Owned For
Owner Type
Purchase Details
Closed on
Dec 28, 2012
Sold by
Powell Trevor S and Powell Brittany
Bought by
Powell Trevor S
Current Estimated Value
Home Financials for this Owner
Home Financials are based on the most recent Mortgage that was taken out on this home.
Original Mortgage
$69,400
Outstanding Balance
$47,683
Interest Rate
3.27%
Mortgage Type
New Conventional
Estimated Equity
$214,623
Purchase Details
Closed on
Jun 22, 2007
Sold by
Powell Trevor S
Bought by
Powell Trevor S and Powell Brittany
Home Financials for this Owner
Home Financials are based on the most recent Mortgage that was taken out on this home.
Original Mortgage
$72,800
Interest Rate
6.16%
Mortgage Type
New Conventional
Purchase Details
Closed on
May 10, 2005
Sold by
Dalton Miguel E and Dalton Melissa L
Bought by
Johnsen Jacob E and Woodward Britney
Home Financials for this Owner
Home Financials are based on the most recent Mortgage that was taken out on this home.
Original Mortgage
$76,950
Interest Rate
5.25%
Mortgage Type
Adjustable Rate Mortgage/ARM
Create a Home Valuation Report for This Property
The Home Valuation Report is an in-depth analysis detailing your home's value as well as a comparison with similar homes in the area
Home Values in the Area
Average Home Value in this Area
Purchase History
| Date | Buyer | Sale Price | Title Company |
|---|---|---|---|
| Powell Trevor S | -- | Hickman Land Title Company | |
| Powell Trevor S | -- | Advanced Title | |
| Powell Trevor S | -- | Advanced Title | |
| Johnsen Jacob E | -- | Cache Title Company |
Source: Public Records
Mortgage History
| Date | Status | Borrower | Loan Amount |
|---|---|---|---|
| Open | Powell Trevor S | $69,400 | |
| Closed | Powell Trevor S | $72,800 | |
| Previous Owner | Johnsen Jacob E | $76,950 |
Source: Public Records
Tax History
| Year | Tax Paid | Tax Assessment Tax Assessment Total Assessment is a certain percentage of the fair market value that is determined by local assessors to be the total taxable value of land and additions on the property. | Land | Improvement |
|---|---|---|---|---|
| 2025 | $1,085 | $140,375 | $0 | $0 |
| 2024 | $1,109 | $138,915 | $0 | $0 |
| 2023 | $1,233 | $147,180 | $0 | $0 |
| 2022 | $1,357 | $151,250 | $0 | $0 |
| 2021 | $1,155 | $198,890 | $50,000 | $148,890 |
| 2020 | $997 | $154,600 | $30,000 | $124,600 |
| 2019 | $925 | $137,272 | $30,000 | $107,272 |
| 2018 | $910 | $123,280 | $30,000 | $93,280 |
| 2017 | $805 | $57,640 | $0 | $0 |
| 2016 | $835 | $48,070 | $0 | $0 |
| 2015 | $692 | $47,745 | $0 | $0 |
| 2014 | $626 | $47,745 | $0 | $0 |
| 2013 | -- | $47,745 | $0 | $0 |
Source: Public Records
Map
Nearby Homes
- 137 W 1309 S
- 168 W 1275 S
- 1556 Talon Dr
- 593 W 300 S
- 1320 Country Manor Dr
- 473 W 40 S Unit H102
- 472 W 40 S Unit 203
- 460 W 15 S Unit G202
- 470 W 15 S Unit F301
- 460 W 15 S Unit G201
- 426 W 15 S
- 10 S 410 W
- 513 W 400 S Unit 54
- 268 W 1030 S
- 238 W 1010 S Unit 43
- 233 W 1010 S
- 839 S 300 W
- 866 Riverwood Dr
- 600 W 300 S
- 185 S 200 W
Your Personal Tour Guide
Ask me questions while you tour the home.