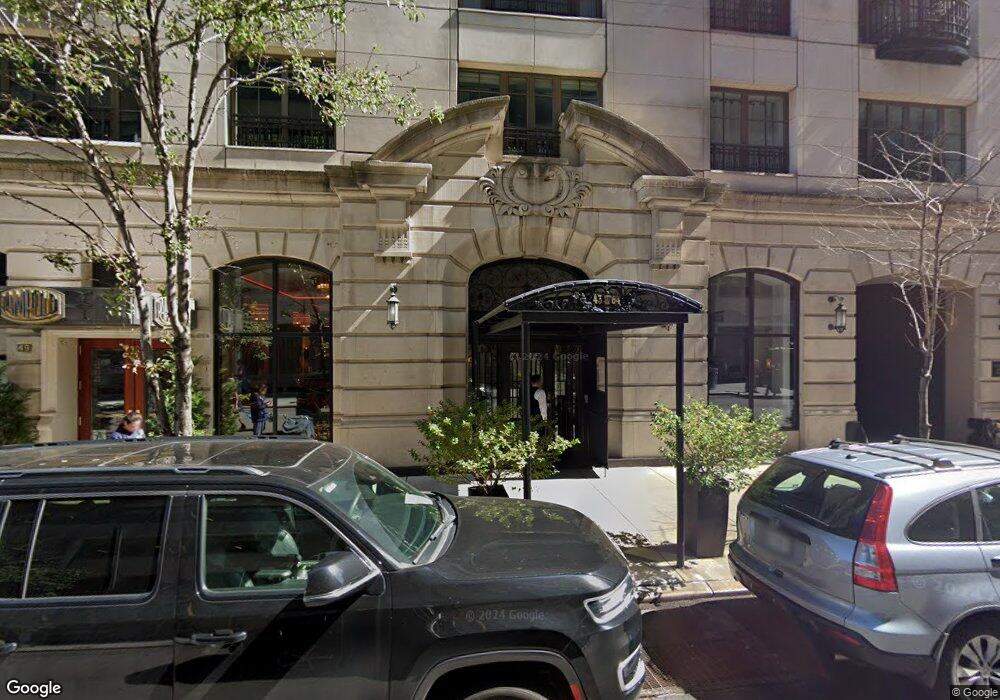
43 W 64th St Unit 8D New York, NY 10023
Lincoln Square NeighborhoodEstimated Value: $2,324,515 - $3,598,000
2
Beds
2
Baths
1,585
Sq Ft
$1,809/Sq Ft
Est. Value
About This Home
This home is located at 43 W 64th St Unit 8D, New York, NY 10023 and is currently estimated at $2,867,879, approximately $1,809 per square foot. 43 W 64th St Unit 8D is a home located in New York County with nearby schools including P.S. 452, Ethical Culture-Fieldston School, and The Gateway School.
Ownership History
Date
Name
Owned For
Owner Type
Purchase Details
Closed on
Aug 22, 2017
Sold by
Raccard Properties Llc
Bought by
Raccard Properties Llc Series A-1
Current Estimated Value
Purchase Details
Closed on
Mar 19, 2015
Sold by
43 West 64Th Llc
Bought by
Raccard Properties Llc
Purchase Details
Closed on
Sep 27, 2012
Sold by
Lobato Grabowsky Beatriz
Bought by
43 West 64Th Llc
Purchase Details
Closed on
Nov 30, 2009
Sold by
Mescon Jane and Mescon Richard
Bought by
Grabowsky Beatriz Lobato
Purchase Details
Closed on
Jun 23, 2006
Sold by
Mcdonald Jenifer and Mcdonald Stephen
Bought by
Mescon Jane and Mescon Richard
Purchase Details
Closed on
Jan 27, 2004
Sold by
Athena-Liberty Lofts L P
Bought by
Mcdonald Jenifer and Mcdonald Stephen
Home Financials for this Owner
Home Financials are based on the most recent Mortgage that was taken out on this home.
Original Mortgage
$1,300,000
Interest Rate
5.82%
Mortgage Type
Purchase Money Mortgage
Create a Home Valuation Report for This Property
The Home Valuation Report is an in-depth analysis detailing your home's value as well as a comparison with similar homes in the area
Home Values in the Area
Average Home Value in this Area
Purchase History
| Date | Buyer | Sale Price | Title Company |
|---|---|---|---|
| Raccard Properties Llc Series A-1 | -- | -- | |
| Raccard Properties Llc | $4,600,000 | -- | |
| 43 West 64Th Llc | $2,542,000 | -- | |
| Grabowsky Beatriz Lobato | $2,429,460 | -- | |
| Mescon Jane | $2,200,000 | -- | |
| Mcdonald Jenifer | $1,832,850 | -- |
Source: Public Records
Mortgage History
| Date | Status | Borrower | Loan Amount |
|---|---|---|---|
| Previous Owner | Mcdonald Jenifer | $1,300,000 |
Source: Public Records
Tax History Compared to Growth
Tax History
| Year | Tax Paid | Tax Assessment Tax Assessment Total Assessment is a certain percentage of the fair market value that is determined by local assessors to be the total taxable value of land and additions on the property. | Land | Improvement |
|---|---|---|---|---|
| 2025 | $29,797 | $231,121 | $85,224 | $145,897 |
| 2024 | $29,797 | $238,338 | $85,224 | $153,114 |
| 2023 | $28,148 | $229,458 | $85,224 | $144,234 |
| 2022 | $27,645 | $226,237 | $85,224 | $141,013 |
| 2021 | $27,030 | $220,350 | $85,224 | $135,126 |
| 2020 | $27,142 | $245,193 | $85,224 | $159,969 |
| 2019 | $26,133 | $240,663 | $85,224 | $155,439 |
| 2018 | $24,207 | $211,011 | $85,224 | $125,787 |
| 2017 | $22,881 | $213,726 | $85,224 | $128,502 |
| 2016 | $21,794 | $191,147 | $85,223 | $105,924 |
| 2015 | $11,829 | $179,497 | $85,223 | $94,274 |
| 2014 | $11,829 | $168,845 | $85,224 | $83,621 |
Source: Public Records
Map
Nearby Homes
- 25 W 64th St Unit 2F
- 25 W 64th St Unit 7D
- 17 W 64th St Unit 2E
- 17 W 64th St Unit 1D
- 17 W 64th St Unit 9F
- 17 W 64th St Unit 8C
- 29 W 64th St Unit 5C
- 46 W 65th St Unit 3-D
- 46 W 65th St Unit 1B
- 43 W 64th St Unit 4B
- 43 W 64th St Unit PH9D
- 8 W 65th St Unit 5A
- 20 W 64th St Unit 20K
- 20 W 64th St Unit 41-H
- 15 W 63rd St Unit 21A
- 15 W 63rd St Unit 20B
- 50 Central Park W Unit Maisonette Duplex
- 41 Central Park W Unit 11A
- 29 W 65th St Unit 2B
- 10 W 66th St Unit 29E
- 43 W 64th St Unit STOR3
- 43 W 64th St Unit STOR2
- 43 W 64th St Unit STOR1
- 43 W 64th St Unit PH14A
- 43 W 64th St Unit STOR9
- 43 W 64th St Unit STOR8
- 43 W 64th St Unit STOR7
- 43 W 64th St Unit STOR6
- 43 W 64th St Unit STOR5
- 43 W 64th St Unit STOR4
- 43 W 64th St Unit PH12B
- 43 W 64th St Unit PH12A
- 43 W 64th St Unit PH10B
- 43 W 64th St Unit PH10A
- 43 W 64th St Unit PH9C
- 43 W 64th St Unit PH9B
- 43 W 64th St Unit PH9A
- 43 W 64th St Unit 8C
- 43 W 64th St Unit 8B
- 43 W 64th St Unit 8A