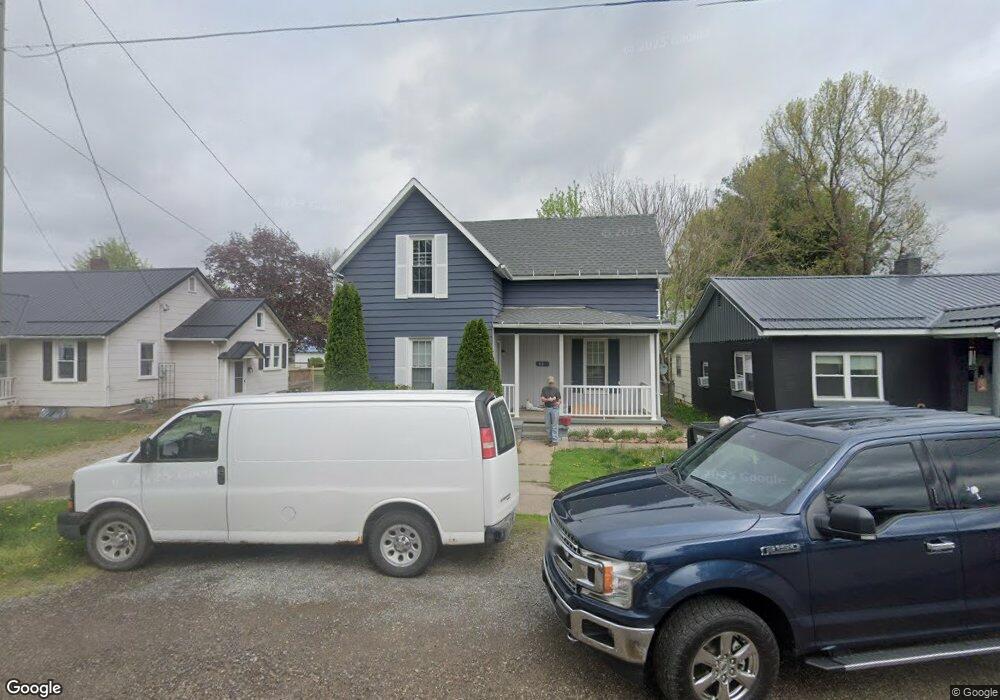
43 W 8th St Dresden, OH 43821
Estimated Value: $160,000 - $223,000
3
Beds
1
Bath
1,421
Sq Ft
$135/Sq Ft
Est. Value
About This Home
This home is located at 43 W 8th St, Dresden, OH 43821 and is currently estimated at $191,626, approximately $134 per square foot. 43 W 8th St is a home located in Muskingum County with nearby schools including Tri-Valley High School.
Ownership History
Date
Name
Owned For
Owner Type
Purchase Details
Closed on
Oct 15, 2014
Sold by
Hamilton Connie and Hamilton Connie L
Bought by
The Community Bank
Current Estimated Value
Purchase Details
Closed on
Jan 10, 2011
Sold by
Federal Home Loan Mortgage Corporation
Bought by
Hamilton Connie B and William B & Connie L Hamilton Revocable
Purchase Details
Closed on
Sep 30, 2010
Sold by
Derrick Michael J
Bought by
Federal Home Loan Mortgage Corp
Purchase Details
Closed on
Jun 1, 2005
Sold by
Hamilton William and Hamilton Connie
Bought by
Derrick Michael J
Home Financials for this Owner
Home Financials are based on the most recent Mortgage that was taken out on this home.
Original Mortgage
$19,990
Interest Rate
5.82%
Mortgage Type
Stand Alone Second
Purchase Details
Closed on
Jul 8, 2004
Sold by
Lacey Paul D and Lacey Mary Jo
Bought by
Hamilton William and Hamilton Connie
Create a Home Valuation Report for This Property
The Home Valuation Report is an in-depth analysis detailing your home's value as well as a comparison with similar homes in the area
Home Values in the Area
Average Home Value in this Area
Purchase History
| Date | Buyer | Sale Price | Title Company |
|---|---|---|---|
| The Community Bank | $59,200 | Attorney | |
| Hamilton Connie B | $56,000 | Attorney | |
| Federal Home Loan Mortgage Corp | $40,000 | None Available | |
| Derrick Michael J | $100,000 | -- | |
| Swope Tamra K | -- | -- | |
| Hamilton William | $50,000 | -- |
Source: Public Records
Mortgage History
| Date | Status | Borrower | Loan Amount |
|---|---|---|---|
| Previous Owner | Derrick Michael J | $19,990 | |
| Previous Owner | Derrick Michael J | $79,960 |
Source: Public Records
Tax History Compared to Growth
Tax History
| Year | Tax Paid | Tax Assessment Tax Assessment Total Assessment is a certain percentage of the fair market value that is determined by local assessors to be the total taxable value of land and additions on the property. | Land | Improvement |
|---|---|---|---|---|
| 2024 | $1,453 | $36,330 | $2,485 | $33,845 |
| 2023 | $978 | $22,365 | $2,065 | $20,300 |
| 2022 | $962 | $22,365 | $2,065 | $20,300 |
| 2021 | $860 | $22,365 | $2,065 | $20,300 |
| 2020 | $731 | $20,370 | $1,890 | $18,480 |
| 2019 | $775 | $20,370 | $1,890 | $18,480 |
| 2018 | $790 | $20,370 | $1,890 | $18,480 |
| 2017 | $634 | $14,665 | $1,890 | $12,775 |
| 2016 | $644 | $14,670 | $1,890 | $12,780 |
| 2015 | $651 | $14,670 | $1,890 | $12,780 |
| 2013 | $717 | $14,670 | $1,890 | $12,780 |
Source: Public Records
Map
Nearby Homes
- 815 Chestnut St
- 510 Chestnut St
- 1111 Main St
- 50 W Dave Longaberger Ave
- 10200 N River Rd
- 3695 Hayfield Rd
- 10170 N Morrison Rd
- 4797 Narrows Rd
- 9520 McGlade School Rd
- 0 Copeland Woods Rd
- 5010 Narrows Rd
- 7360 Jones Rd
- 40873 Township Road 64b
- 16030 Township Rd 63
- 14895 County Road 436
- 6705 Frazeysburd Rd
- 14472 County Road 14
- 2505 Kenlo Woods Dr
- 0 County Road 294
- 6705 Frazeysburg Rd