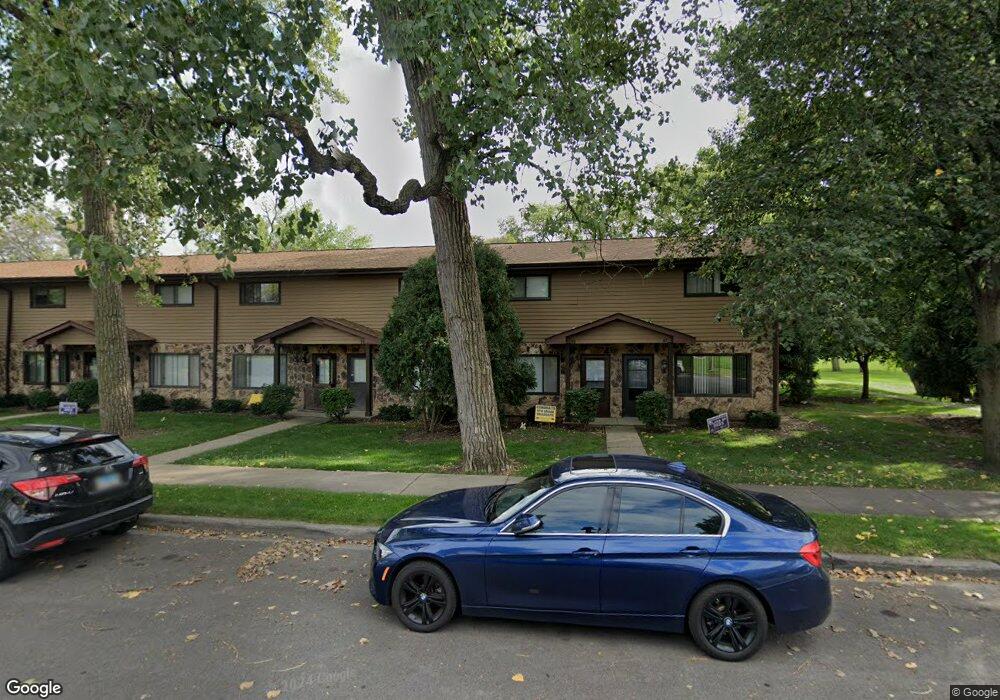
43 W Diversey Ave Addison, IL 60101
Estimated Value: $259,337 - $307,000
--
Bed
1
Bath
1,320
Sq Ft
$222/Sq Ft
Est. Value
About This Home
This home is located at 43 W Diversey Ave, Addison, IL 60101 and is currently estimated at $292,834, approximately $221 per square foot. 43 W Diversey Ave is a home located in DuPage County with nearby schools including Fullerton Elementary School, Indian Trail Jr High School, and Addison Trail High School.
Ownership History
Date
Name
Owned For
Owner Type
Purchase Details
Closed on
Jul 15, 2002
Sold by
Armenta Raul and Martinez Cristina
Bought by
Jaimes Eliceo and Lopez Elba
Current Estimated Value
Home Financials for this Owner
Home Financials are based on the most recent Mortgage that was taken out on this home.
Original Mortgage
$151,300
Outstanding Balance
$63,730
Interest Rate
6.62%
Mortgage Type
Purchase Money Mortgage
Estimated Equity
$229,105
Purchase Details
Closed on
Jun 21, 2001
Sold by
Armenta Raul and Armenta Gabriel
Bought by
Armenta Raul and Martinez Cristina
Home Financials for this Owner
Home Financials are based on the most recent Mortgage that was taken out on this home.
Original Mortgage
$107,894
Interest Rate
7.22%
Mortgage Type
FHA
Purchase Details
Closed on
Jan 30, 1998
Sold by
Emerson Dawn M
Bought by
Armenta Raul and Armenta Gabriel
Home Financials for this Owner
Home Financials are based on the most recent Mortgage that was taken out on this home.
Original Mortgage
$103,477
Interest Rate
7.16%
Mortgage Type
FHA
Create a Home Valuation Report for This Property
The Home Valuation Report is an in-depth analysis detailing your home's value as well as a comparison with similar homes in the area
Home Values in the Area
Average Home Value in this Area
Purchase History
| Date | Buyer | Sale Price | Title Company |
|---|---|---|---|
| Jaimes Eliceo | $156,000 | -- | |
| Armenta Raul | -- | -- | |
| Armenta Raul | $104,000 | -- |
Source: Public Records
Mortgage History
| Date | Status | Borrower | Loan Amount |
|---|---|---|---|
| Open | Jaimes Eliceo | $151,300 | |
| Previous Owner | Armenta Raul | $107,894 | |
| Previous Owner | Armenta Raul | $103,477 |
Source: Public Records
Tax History Compared to Growth
Tax History
| Year | Tax Paid | Tax Assessment Tax Assessment Total Assessment is a certain percentage of the fair market value that is determined by local assessors to be the total taxable value of land and additions on the property. | Land | Improvement |
|---|---|---|---|---|
| 2024 | $3,303 | $54,868 | $9,148 | $45,720 |
| 2023 | $3,124 | $50,440 | $8,410 | $42,030 |
| 2022 | $2,981 | $46,470 | $7,750 | $38,720 |
| 2021 | $2,844 | $44,510 | $7,420 | $37,090 |
| 2020 | $2,756 | $42,640 | $7,110 | $35,530 |
| 2019 | $2,725 | $41,000 | $6,840 | $34,160 |
| 2018 | $2,841 | $41,000 | $6,840 | $34,160 |
| 2017 | $2,755 | $39,190 | $6,540 | $32,650 |
| 2016 | $2,656 | $36,180 | $6,040 | $30,140 |
| 2015 | $2,563 | $33,420 | $5,580 | $27,840 |
| 2014 | $3,134 | $39,310 | $6,560 | $32,750 |
| 2013 | $3,076 | $40,110 | $6,690 | $33,420 |
Source: Public Records
Map
Nearby Homes
- 10 N Adams Dr
- 200 Addison Rd
- 152 N May St
- 36 S Highview Ave
- 427 W Moreland Ave
- 133 E Lake St
- 19W068 E North Ave
- 110 S Evergreen Ave
- 539 W Rose Ave
- 235 N Mill Rd Unit 115B
- 231 N Mill Rd Unit 11
- 84 N Mill Rd
- 426 S Adeline Ave
- 621 W Natalie Ln
- 86 W Elizabeth Dr
- 126 W Elizabeth Dr
- 68 W Elizabeth Dr
- 257 Masters Dr
- 385 Masters Dr
- 379 Masters Dr
- 39 W Diversey Ave
- 47 W Diversey Ave
- 35 W Diversey Ave
- 31 W Diversey Ave
- 27 W Diversey Ave
- 23 W Diversey Ave
- 19 W Diversey Ave
- 15 W Diversey Ave
- 54 S Ruga Ct
- 60 S Ruga Ct
- 64 S Ruga Ct
- 51 S Ruga Ct
- 59 S Ruga Ct Unit 7
- 63 S Ruga Ct
- 2 N Church St
- 68 S Ruga Ct
- 3 N Church St
- 72 S Ruga Ct
- 73 Ruga Ct
- 76 S Ruga Ct