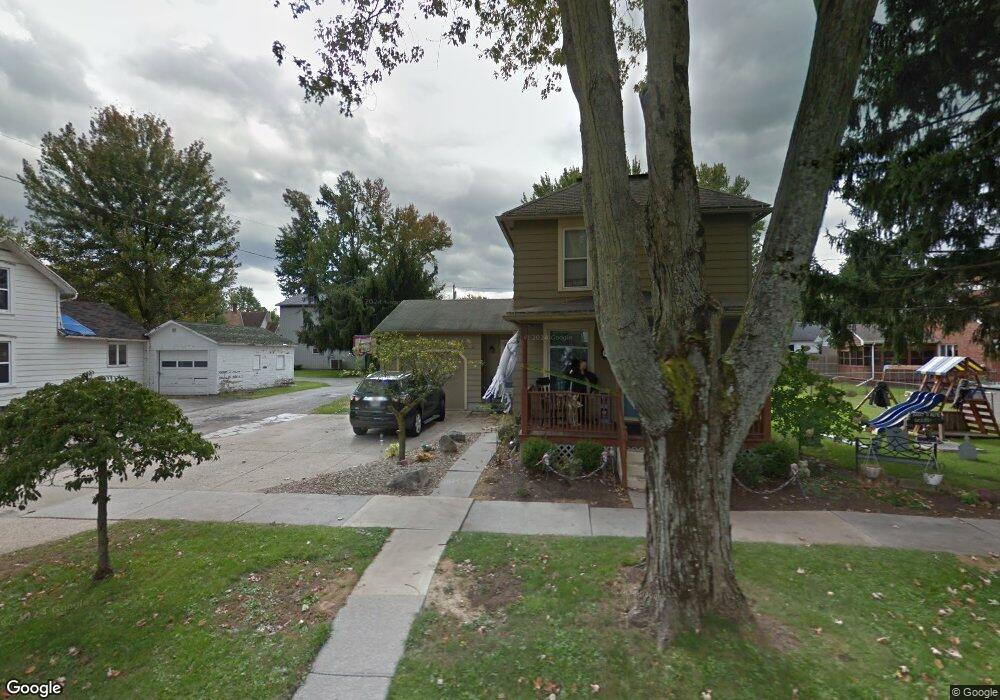
43 W Elm St Norwalk, OH 44857
Estimated Value: $176,001 - $190,000
3
Beds
2
Baths
1,322
Sq Ft
$137/Sq Ft
Est. Value
About This Home
This home is located at 43 W Elm St, Norwalk, OH 44857 and is currently estimated at $181,000, approximately $136 per square foot. 43 W Elm St is a home located in Huron County with nearby schools including Maplehurst Elementary School, Pleasant Elementary School, and League Elementary School.
Ownership History
Date
Name
Owned For
Owner Type
Purchase Details
Closed on
Feb 29, 2024
Bought by
Chase Michael F Chase and Surv Laura C
Current Estimated Value
Purchase Details
Closed on
Feb 28, 2024
Sold by
Chase Michael F and Chase Laura C
Bought by
Chase Michael F and Chase Laura C
Purchase Details
Closed on
Sep 17, 2004
Bought by
Chase Michael F
Purchase Details
Closed on
Jul 16, 2004
Bought by
Chase Michael F
Purchase Details
Closed on
May 5, 2004
Bought by
Bahleda Katherine R
Purchase Details
Closed on
Feb 26, 1999
Sold by
Hannel Margaret L
Bought by
Rossman Eugene T and Bahleda Katherine R
Home Financials for this Owner
Home Financials are based on the most recent Mortgage that was taken out on this home.
Original Mortgage
$74,386
Interest Rate
6.92%
Mortgage Type
FHA
Purchase Details
Closed on
Aug 24, 1978
Bought by
Hannel Margaret L
Create a Home Valuation Report for This Property
The Home Valuation Report is an in-depth analysis detailing your home's value as well as a comparison with similar homes in the area
Home Values in the Area
Average Home Value in this Area
Purchase History
| Date | Buyer | Sale Price | Title Company |
|---|---|---|---|
| Chase Michael F Chase | -- | -- | |
| Chase Michael F | -- | None Listed On Document | |
| Chase Michael F | -- | -- | |
| Chase Michael F | $110,000 | -- | |
| Bahleda Katherine R | -- | -- | |
| Rossman Eugene T | $75,000 | -- | |
| Hannel Margaret L | -- | -- |
Source: Public Records
Mortgage History
| Date | Status | Borrower | Loan Amount |
|---|---|---|---|
| Previous Owner | Rossman Eugene T | $74,386 |
Source: Public Records
Tax History Compared to Growth
Tax History
| Year | Tax Paid | Tax Assessment Tax Assessment Total Assessment is a certain percentage of the fair market value that is determined by local assessors to be the total taxable value of land and additions on the property. | Land | Improvement |
|---|---|---|---|---|
| 2024 | $1,899 | $46,530 | $5,650 | $40,880 |
| 2023 | $1,899 | $36,830 | $4,530 | $32,300 |
| 2022 | $1,484 | $36,830 | $4,530 | $32,300 |
| 2021 | $1,485 | $36,830 | $4,530 | $32,300 |
| 2020 | $1,340 | $31,620 | $3,750 | $27,870 |
| 2019 | $1,311 | $31,620 | $3,750 | $27,870 |
| 2018 | $1,288 | $31,620 | $3,750 | $27,870 |
| 2017 | $1,095 | $26,800 | $3,750 | $23,050 |
| 2016 | $1,075 | $26,800 | $3,750 | $23,050 |
| 2015 | $1,074 | $26,820 | $3,760 | $23,060 |
| 2014 | $1,054 | $26,080 | $3,750 | $22,330 |
| 2013 | $916 | $26,080 | $3,750 | $22,330 |
Source: Public Records
Map
Nearby Homes
- 21 Maple St
- 40 Norwood Ave
- 29 W Seminary St
- 15 W Chestnut St
- 111 W Main St
- 29 Harris Ave
- 12 Minard Place
- 58 E Elm St
- 157 W Main St
- 14 Corwin St
- 29 Corwin St
- 85 Woodlawn Ave
- 123 E Main St
- 57 Milan Ave
- 37 S Garden St
- 120 Woodlawn Ave
- 15 E Washington St
- 102 N Pleasant St
- 167 Whittlesey Ave
- 13 Spring St