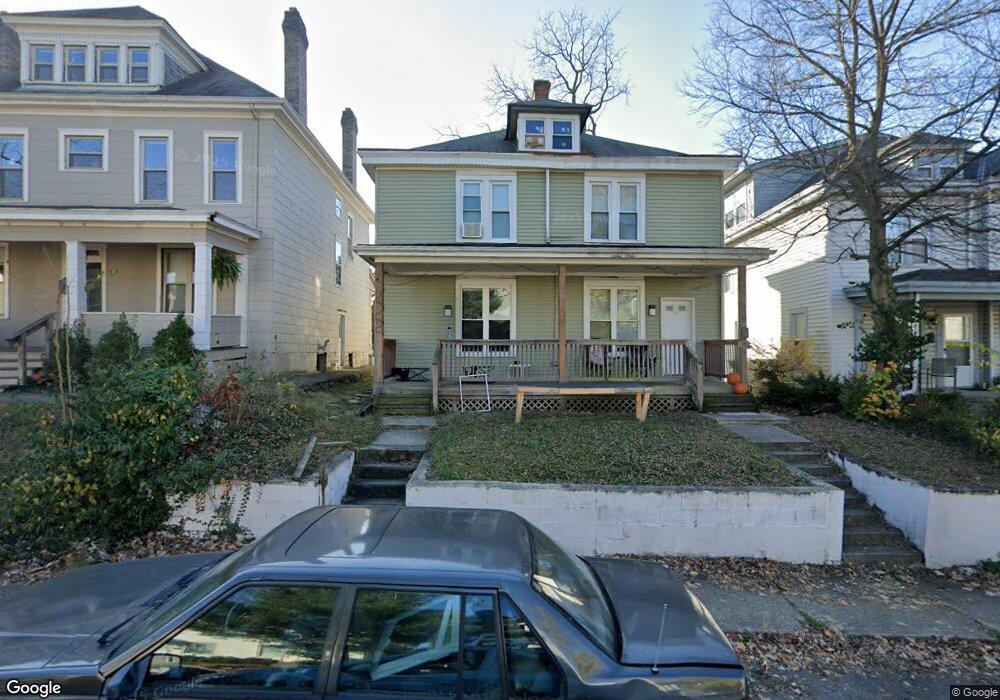
43 W Maynard Ave Unit 45 Columbus, OH 43202
Old North Columbus NeighborhoodEstimated Value: $376,000 - $458,000
5
Beds
2
Baths
2,160
Sq Ft
$193/Sq Ft
Est. Value
About This Home
This home is located at 43 W Maynard Ave Unit 45, Columbus, OH 43202 and is currently estimated at $417,920, approximately $193 per square foot. 43 W Maynard Ave Unit 45 is a home located in Franklin County with nearby schools including Hubbard Elementary School, Dominion Middle School, and Whetstone High School.
Ownership History
Date
Name
Owned For
Owner Type
Purchase Details
Closed on
Sep 22, 2015
Sold by
Sip Vii Ltd
Bought by
Smith Investment Properties Ltd
Current Estimated Value
Purchase Details
Closed on
Oct 25, 2010
Sold by
Proodian John D and Proodian Janet E
Bought by
Sip Vii Ltd
Home Financials for this Owner
Home Financials are based on the most recent Mortgage that was taken out on this home.
Original Mortgage
$134,400
Interest Rate
4.3%
Mortgage Type
Future Advance Clause Open End Mortgage
Purchase Details
Closed on
Mar 25, 2009
Sold by
Byrne John J and Byrne Maureen T
Bought by
Proodian John D and Proodian Janet E
Home Financials for this Owner
Home Financials are based on the most recent Mortgage that was taken out on this home.
Original Mortgage
$92,000
Interest Rate
6.25%
Mortgage Type
Future Advance Clause Open End Mortgage
Purchase Details
Closed on
Feb 28, 2008
Sold by
Johnson Lynette V
Bought by
Byrne John J and Byrne Maureen T
Purchase Details
Closed on
Jan 21, 1963
Bought by
Young
Create a Home Valuation Report for This Property
The Home Valuation Report is an in-depth analysis detailing your home's value as well as a comparison with similar homes in the area
Home Values in the Area
Average Home Value in this Area
Purchase History
| Date | Buyer | Sale Price | Title Company |
|---|---|---|---|
| Smith Investment Properties Ltd | -- | Amerititle | |
| Sip Vii Ltd | $168,000 | Amerititle | |
| Proodian John D | $115,000 | Peak Title | |
| Byrne John J | $80,000 | Attorney | |
| Young | -- | -- |
Source: Public Records
Mortgage History
| Date | Status | Borrower | Loan Amount |
|---|---|---|---|
| Previous Owner | Sip Vii Ltd | $134,400 | |
| Previous Owner | Proodian John D | $92,000 |
Source: Public Records
Tax History Compared to Growth
Tax History
| Year | Tax Paid | Tax Assessment Tax Assessment Total Assessment is a certain percentage of the fair market value that is determined by local assessors to be the total taxable value of land and additions on the property. | Land | Improvement |
|---|---|---|---|---|
| 2024 | $5,954 | $129,930 | $36,580 | $93,350 |
| 2023 | $5,880 | $129,920 | $36,575 | $93,345 |
| 2022 | $4,651 | $87,510 | $26,430 | $61,080 |
| 2021 | $4,659 | $87,510 | $26,430 | $61,080 |
| 2020 | $4,666 | $87,510 | $26,430 | $61,080 |
| 2019 | $4,503 | $70,000 | $21,140 | $48,860 |
| 2018 | $4,212 | $70,000 | $21,140 | $48,860 |
| 2017 | $4,384 | $70,000 | $21,140 | $48,860 |
| 2016 | $4,366 | $63,530 | $17,780 | $45,750 |
| 2015 | $3,929 | $63,530 | $17,780 | $45,750 |
| 2014 | $3,939 | $63,530 | $17,780 | $45,750 |
| 2013 | $1,766 | $57,750 | $16,170 | $41,580 |
Source: Public Records
Map
Nearby Homes
- 6 E Blake Ave
- 69-71 E Duncan St
- 116-118 E Hudson St
- 9 E Norwich Ave Unit 15
- 2627 Neil Ave
- 185 E Tompkins St
- 198 E Maynard Ave
- 223-225 E Maynard Ave
- 2683 Neil Ave Unit 685
- 2537 Medary Ave Unit 539
- 241 E Blake Ave
- 223 E Patterson Ave
- 109-117 E Arcadia Ave
- 217 E Oakland Ave
- 2251 Indiana Ave
- 2241 Indiana Ave
- 2350 Indiana Ave
- 328 Wyandotte Ave Unit 326
- 2584 Deming Ave
- 261 E Northwood Ave Unit 40
- 49 W Maynard Ave Unit 51
- 53 W Maynard Ave
- 51 W Maynard Ave
- 37 E Maynard Ave
- 55 W Maynard Ave
- 59 W Maynard Ave Unit 61
- 46 W Patterson Ave Unit 48
- 50 W Patterson Ave Unit 52
- 56 W Patterson Ave Unit 58
- 40 W Patterson Ave Unit 42
- 44 W Maynard Ave Unit 46
- 63 W Maynard Ave Unit 65
- 42 W Patterson Ave
- 2382 Williams St Unit 384
- 34 E Maynard Ave
- 62 W Patterson Ave Unit 64
- 50 W Maynard Ave Unit 52
- 60 W Patterson Ave
- 38 W Maynard Ave Unit 40
- 32 W Patterson Ave