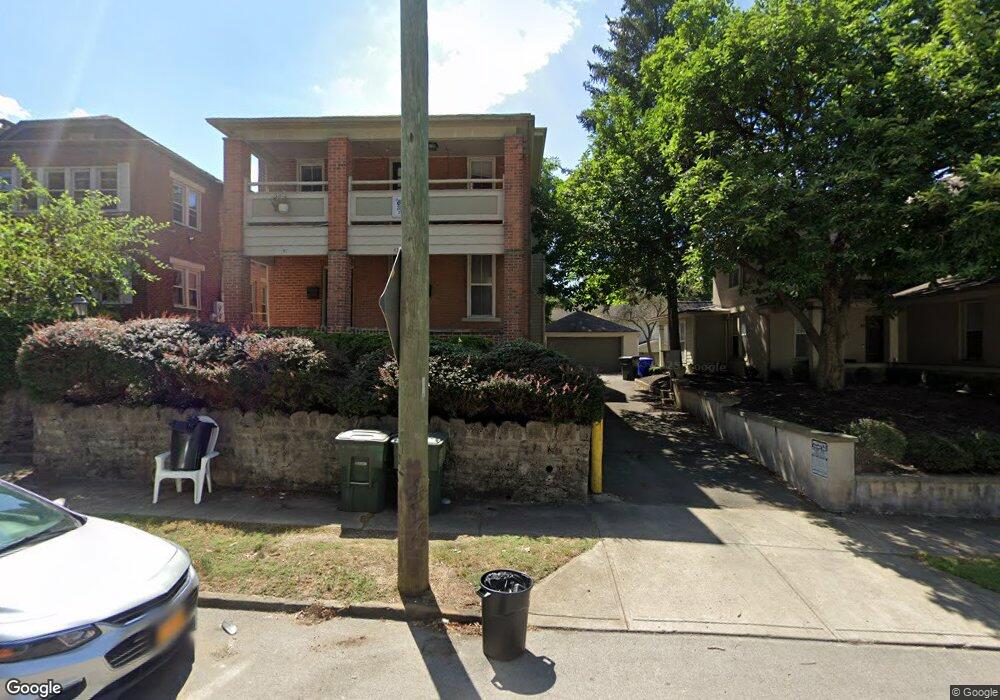
43 W Tompkins St Columbus, OH 43202
Old North Columbus NeighborhoodEstimated Value: $386,000 - $394,000
4
Beds
2
Baths
2,250
Sq Ft
$173/Sq Ft
Est. Value
About This Home
This home is located at 43 W Tompkins St, Columbus, OH 43202 and is currently estimated at $389,382, approximately $173 per square foot. 43 W Tompkins St is a home located in Franklin County with nearby schools including Hubbard Elementary School, Dominion Middle School, and Whetstone High School.
Ownership History
Date
Name
Owned For
Owner Type
Purchase Details
Closed on
Nov 25, 2008
Sold by
Garland Group Iii Ltd
Bought by
Mickley Robert T
Current Estimated Value
Home Financials for this Owner
Home Financials are based on the most recent Mortgage that was taken out on this home.
Original Mortgage
$210,000
Outstanding Balance
$54,841
Interest Rate
6.48%
Mortgage Type
Construction
Estimated Equity
$334,541
Purchase Details
Closed on
Oct 18, 1999
Sold by
Fitch Hoza Judith
Bought by
Hoza Michael J
Home Financials for this Owner
Home Financials are based on the most recent Mortgage that was taken out on this home.
Original Mortgage
$72,000
Interest Rate
7.91%
Purchase Details
Closed on
Jul 8, 1999
Sold by
Hoza Michael J
Bought by
Hoza Judith
Purchase Details
Closed on
Jul 25, 1985
Bought by
Hoza Michael J
Create a Home Valuation Report for This Property
The Home Valuation Report is an in-depth analysis detailing your home's value as well as a comparison with similar homes in the area
Home Values in the Area
Average Home Value in this Area
Purchase History
| Date | Buyer | Sale Price | Title Company |
|---|---|---|---|
| Mickley Robert T | $10,000 | Title Co Lt | |
| Hoza Michael J | $96,000 | Amerititle Agency Inc | |
| Hoza Judith | -- | Amerititle Mill Run | |
| Hoza Michael J | $52,000 | -- |
Source: Public Records
Mortgage History
| Date | Status | Borrower | Loan Amount |
|---|---|---|---|
| Open | Mickley Robert T | $210,000 | |
| Previous Owner | Hoza Michael J | $72,000 |
Source: Public Records
Tax History Compared to Growth
Tax History
| Year | Tax Paid | Tax Assessment Tax Assessment Total Assessment is a certain percentage of the fair market value that is determined by local assessors to be the total taxable value of land and additions on the property. | Land | Improvement |
|---|---|---|---|---|
| 2024 | $5,379 | $119,850 | $32,450 | $87,400 |
| 2023 | $5,310 | $119,850 | $32,450 | $87,400 |
| 2022 | $3,863 | $74,480 | $19,810 | $54,670 |
| 2021 | $3,870 | $74,480 | $19,810 | $54,670 |
| 2020 | $3,875 | $74,480 | $19,810 | $54,670 |
| 2019 | $3,614 | $59,580 | $15,860 | $43,720 |
| 2018 | $3,500 | $59,580 | $15,860 | $43,720 |
| 2017 | $3,612 | $59,580 | $15,860 | $43,720 |
| 2016 | $3,738 | $56,430 | $8,860 | $47,570 |
| 2015 | $3,393 | $56,430 | $8,860 | $47,570 |
| 2014 | $3,402 | $56,430 | $8,860 | $47,570 |
| 2013 | $1,525 | $51,275 | $8,050 | $43,225 |
Source: Public Records
Map
Nearby Homes
- 6 E Blake Ave
- 2627 Neil Ave
- 69-71 E Duncan St
- 116-118 E Hudson St
- 2683 Neil Ave Unit 685
- 109-117 E Arcadia Ave
- 185 E Tompkins St
- 2537 Medary Ave Unit 539
- 198 E Maynard Ave
- 241 E Blake Ave
- 9 E Norwich Ave Unit 15
- 223-225 E Maynard Ave
- 2584 Deming Ave
- 223 E Patterson Ave
- 217 E Oakland Ave
- 360-364 E Tompkins St
- 2680 Deming Ave
- 116 Olentangy Point Unit J116
- 363 E Hudson St Unit 365
- 2350 Indiana Ave
- 41 W Tompkins St Unit 43
- 49 W Tompkins St
- 37 W Tompkins St Unit B
- 37 W Tompkins St Unit D
- 37 W Tompkins St
- 33 W Tompkins St
- 55 W Tompkins St
- 29 W Tompkins St
- 29 W Tompkins St
- 57 W Tompkins St
- 64 Bucks Alley
- 50 Bucks Alley
- 23 W Tompkins St
- 63 W Tompkins St Unit 63
- 63 W Tompkins St
- 2482 Neil Ave
- 2482 Neil Ave Unit 2
- 2478 Neil Ave
- 34 W Tompkins St
- 2472 Neil Ave