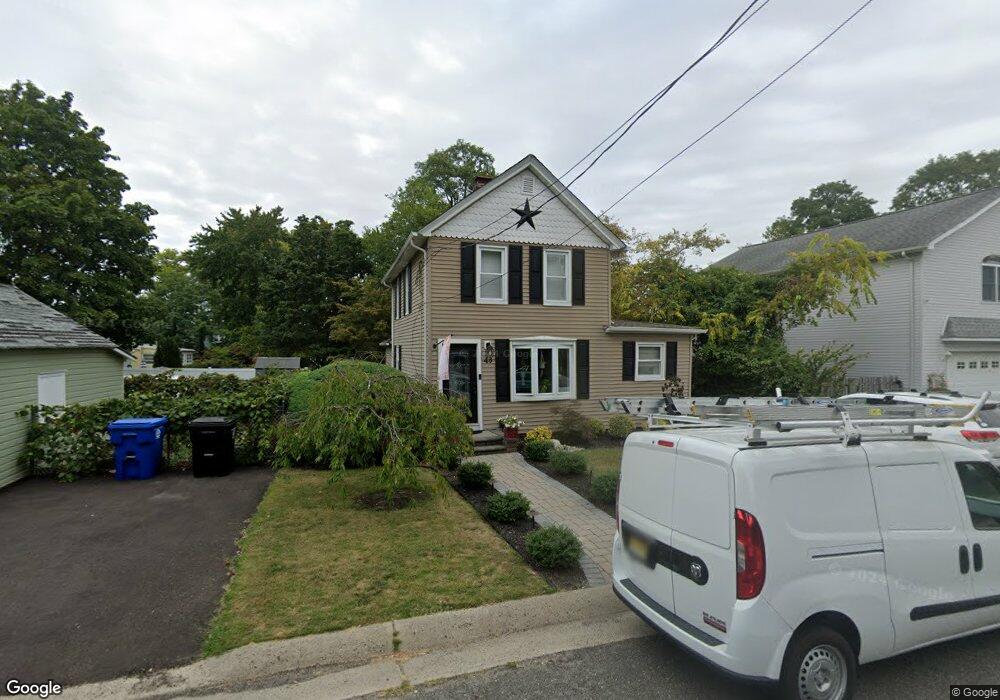
43 Walling Ave Belford, NJ 07718
New Monmouth NeighborhoodEstimated Value: $340,000 - $468,000
2
Beds
1
Bath
1,056
Sq Ft
$399/Sq Ft
Est. Value
About This Home
This home is located at 43 Walling Ave, Belford, NJ 07718 and is currently estimated at $421,201, approximately $398 per square foot. 43 Walling Ave is a home located in Monmouth County with nearby schools including New Monmouth Elementary School, Thorne Middle School, and Middletown High School North.
Ownership History
Date
Name
Owned For
Owner Type
Purchase Details
Closed on
Dec 8, 2003
Sold by
Sutton Thomas
Bought by
Curreri Patricia and Regan Charlene
Current Estimated Value
Home Financials for this Owner
Home Financials are based on the most recent Mortgage that was taken out on this home.
Original Mortgage
$184,000
Interest Rate
5.8%
Purchase Details
Closed on
Feb 26, 1998
Sold by
Teeple Andrew
Bought by
Sutton Thomas and Sutton Suzanne
Home Financials for this Owner
Home Financials are based on the most recent Mortgage that was taken out on this home.
Original Mortgage
$109,000
Interest Rate
7.09%
Purchase Details
Closed on
Sep 20, 1994
Sold by
Duley Joseph
Bought by
Teeple Andrew and Kim Mc Cusker
Home Financials for this Owner
Home Financials are based on the most recent Mortgage that was taken out on this home.
Original Mortgage
$97,000
Interest Rate
8.5%
Create a Home Valuation Report for This Property
The Home Valuation Report is an in-depth analysis detailing your home's value as well as a comparison with similar homes in the area
Home Values in the Area
Average Home Value in this Area
Purchase History
| Date | Buyer | Sale Price | Title Company |
|---|---|---|---|
| Curreri Patricia | $230,000 | -- | |
| Sutton Thomas | $115,000 | -- | |
| Teeple Andrew | $102,000 | -- |
Source: Public Records
Mortgage History
| Date | Status | Borrower | Loan Amount |
|---|---|---|---|
| Previous Owner | Curreri Patricia | $184,000 | |
| Previous Owner | Sutton Thomas | $109,000 | |
| Previous Owner | Teeple Andrew | $97,000 |
Source: Public Records
Tax History Compared to Growth
Tax History
| Year | Tax Paid | Tax Assessment Tax Assessment Total Assessment is a certain percentage of the fair market value that is determined by local assessors to be the total taxable value of land and additions on the property. | Land | Improvement |
|---|---|---|---|---|
| 2025 | $5,749 | $415,400 | $318,300 | $97,100 |
| 2024 | $5,442 | $349,500 | $254,200 | $95,300 |
| 2023 | $5,442 | $313,100 | $208,900 | $104,200 |
| 2022 | $5,362 | $283,800 | $182,900 | $100,900 |
| 2021 | $5,362 | $257,800 | $168,000 | $89,800 |
| 2020 | $5,225 | $244,400 | $156,700 | $87,700 |
| 2019 | $5,020 | $237,700 | $150,500 | $87,200 |
| 2018 | $4,741 | $218,800 | $135,600 | $83,200 |
| 2017 | $4,919 | $224,700 | $135,600 | $89,100 |
| 2016 | $4,533 | $212,700 | $125,600 | $87,100 |
| 2015 | $4,681 | $212,100 | $125,600 | $86,500 |
| 2014 | $4,632 | $204,700 | $125,600 | $79,100 |
Source: Public Records
Map
Nearby Homes