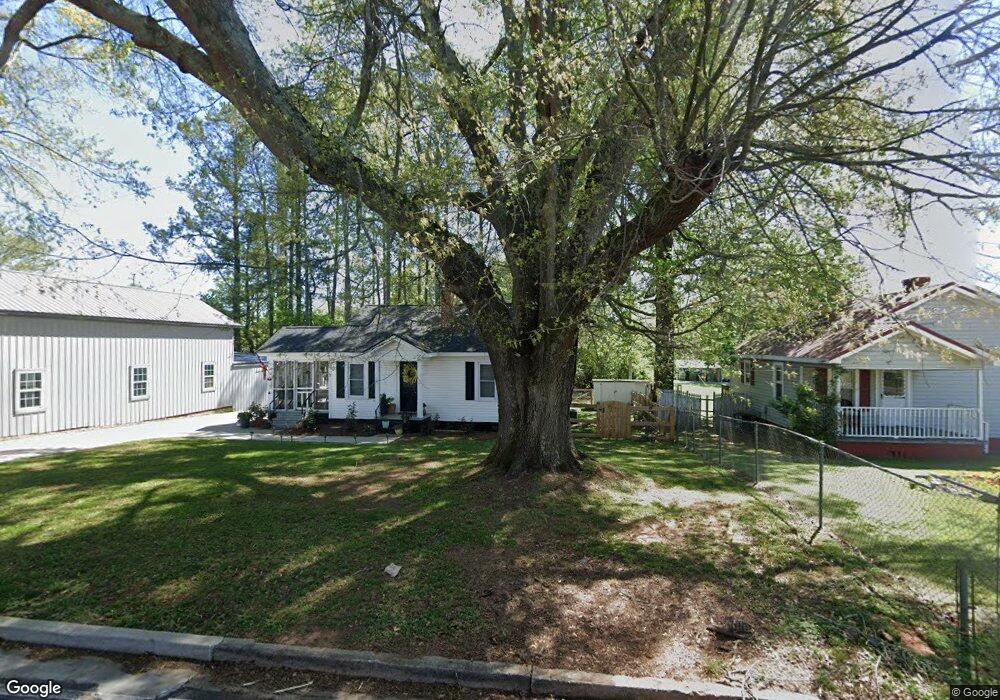
43 Walnut St Aragon, GA 30104
Estimated Value: $159,000 - $195,000
2
Beds
1
Bath
1,000
Sq Ft
$181/Sq Ft
Est. Value
About This Home
This home is located at 43 Walnut St, Aragon, GA 30104 and is currently estimated at $180,850, approximately $180 per square foot. 43 Walnut St is a home with nearby schools including Rockmart Middle School.
Ownership History
Date
Name
Owned For
Owner Type
Purchase Details
Closed on
Apr 7, 2022
Sold by
Harris Andy
Bought by
Wilson Abbegail Harrington and Wilson Richard Todd
Current Estimated Value
Home Financials for this Owner
Home Financials are based on the most recent Mortgage that was taken out on this home.
Original Mortgage
$158,083
Outstanding Balance
$147,047
Interest Rate
3.85%
Mortgage Type
FHA
Estimated Equity
$33,803
Purchase Details
Closed on
May 21, 2021
Sold by
Massey Martha Marie
Bought by
Harris Andy
Purchase Details
Closed on
Aug 12, 1978
Sold by
Buckhalter Ruby and Buckhalter Tal
Bought by
Waddell Martha Faye
Purchase Details
Closed on
Feb 18, 1978
Sold by
Brumbelow Nancy
Bought by
Buckhalter Ruby and Buckhalter Tal
Purchase Details
Closed on
Oct 25, 1963
Sold by
Hindmon Robert
Bought by
Brumbelow Nancy
Purchase Details
Closed on
Sep 19, 1962
Sold by
Knight J Wesley
Bought by
Hindmon Robert
Purchase Details
Closed on
Jan 1, 1901
Bought by
Knight J Wesley
Create a Home Valuation Report for This Property
The Home Valuation Report is an in-depth analysis detailing your home's value as well as a comparison with similar homes in the area
Purchase History
| Date | Buyer | Sale Price | Title Company |
|---|---|---|---|
| Wilson Abbegail Harrington | $180,000 | -- | |
| Harris Andy | $50,000 | -- | |
| Waddell Martha Faye | -- | -- | |
| Buckhalter Ruby | -- | -- | |
| Brumbelow Nancy | -- | -- | |
| Hindmon Robert | -- | -- | |
| Knight J Wesley | -- | -- |
Source: Public Records
Mortgage History
| Date | Status | Borrower | Loan Amount |
|---|---|---|---|
| Open | Wilson Abbegail Harrington | $158,083 |
Source: Public Records
Tax History
| Year | Tax Paid | Tax Assessment Tax Assessment Total Assessment is a certain percentage of the fair market value that is determined by local assessors to be the total taxable value of land and additions on the property. | Land | Improvement |
|---|---|---|---|---|
| 2025 | $1,625 | $58,052 | $8,000 | $50,052 |
| 2024 | $1,607 | $58,052 | $8,000 | $50,052 |
| 2023 | $814 | $26,900 | $640 | $26,260 |
| 2022 | $467 | $19,687 | $640 | $19,047 |
| 2021 | $413 | $17,178 | $640 | $16,538 |
| 2020 | $414 | $17,178 | $640 | $16,538 |
| 2019 | $95 | $12,459 | $1,534 | $10,925 |
| 2018 | $93 | $12,115 | $1,534 | $10,581 |
| 2017 | $90 | $12,115 | $1,534 | $10,581 |
| 2016 | $90 | $12,114 | $1,534 | $10,581 |
| 2015 | $82 | $11,408 | $1,534 | $9,874 |
| 2014 | $78 | $11,058 | $1,183 | $9,874 |
Source: Public Records
Map
Nearby Homes
- 28 Walnut St
- 19 Walnut St
- 30 Oak St
- 34 Elm St
- 0 Rome Hwy 101 Unit 10445422
- 15 Aragon Rd
- 54 Taylorsville Rd
- 3 Magnolia St
- 5 Magnolia St
- 3 Magnolia Blvd
- 7 Magnolia Blvd
- 11 Magnolia St
- 2300 Frettiesburg Dr
- 94 Eastwood Path
- 65 Long Station Rd
- 1638 Prospect Rd
- 70 N Bellview Rd
- 88 N Bellview Rd
- 38 Sarahs Hollow Dr
- 156 Dogwood Glen Dr
Your Personal Tour Guide
Ask me questions while you tour the home.