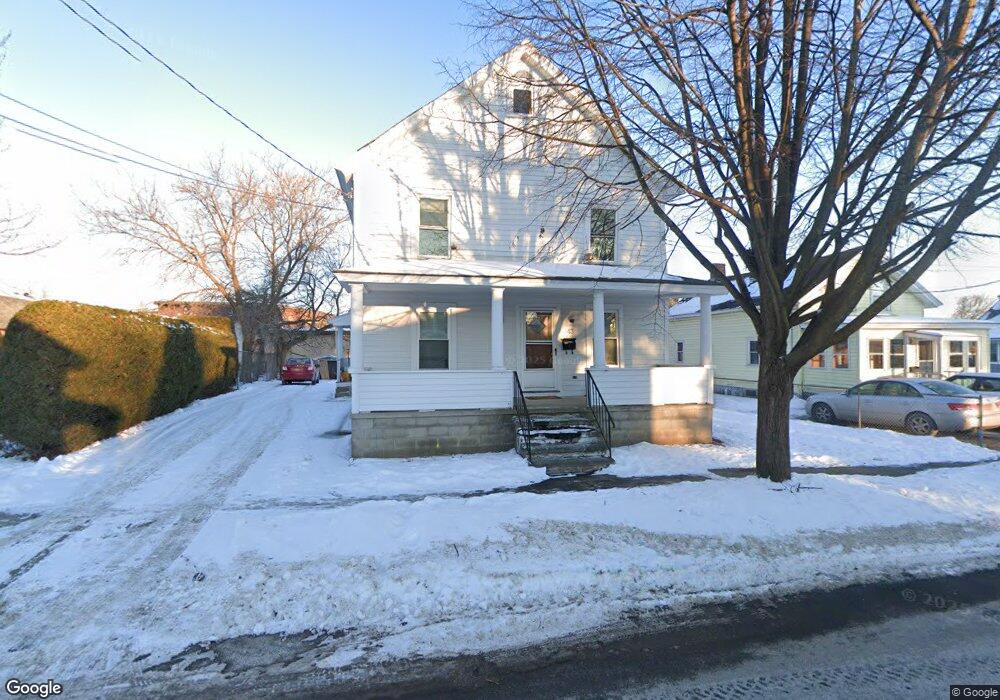
43 Walnut St Glens Falls, NY 12801
Estimated Value: $202,000 - $240,802
4
Beds
2
Baths
1,600
Sq Ft
$137/Sq Ft
Est. Value
About This Home
This home is located at 43 Walnut St, Glens Falls, NY 12801 and is currently estimated at $218,951, approximately $136 per square foot. 43 Walnut St is a home located in Warren County with nearby schools including Abraham Wing School and St. Mary's - St. Alphonsus Regional Catholic School.
Ownership History
Date
Name
Owned For
Owner Type
Purchase Details
Closed on
Apr 19, 2023
Sold by
Santa-Croce Diane M and Santa-Croce John J
Bought by
Sisco Kyle
Current Estimated Value
Home Financials for this Owner
Home Financials are based on the most recent Mortgage that was taken out on this home.
Original Mortgage
$136,000
Outstanding Balance
$132,022
Interest Rate
6.32%
Mortgage Type
Purchase Money Mortgage
Estimated Equity
$86,929
Purchase Details
Closed on
Mar 27, 2023
Sold by
Santa-Croce Diane M and Santa-Croce John J
Bought by
Sisco Kyle
Home Financials for this Owner
Home Financials are based on the most recent Mortgage that was taken out on this home.
Original Mortgage
$136,000
Outstanding Balance
$132,022
Interest Rate
6.32%
Mortgage Type
Purchase Money Mortgage
Estimated Equity
$86,929
Create a Home Valuation Report for This Property
The Home Valuation Report is an in-depth analysis detailing your home's value as well as a comparison with similar homes in the area
Home Values in the Area
Average Home Value in this Area
Purchase History
| Date | Buyer | Sale Price | Title Company |
|---|---|---|---|
| Sisco Kyle | -- | None Available | |
| Sisco Kyle | $170,000 | None Available |
Source: Public Records
Mortgage History
| Date | Status | Borrower | Loan Amount |
|---|---|---|---|
| Open | Sisco Kyle | $136,000 |
Source: Public Records
Tax History
| Year | Tax Paid | Tax Assessment Tax Assessment Total Assessment is a certain percentage of the fair market value that is determined by local assessors to be the total taxable value of land and additions on the property. | Land | Improvement |
|---|---|---|---|---|
| 2024 | $4,505 | $181,000 | $36,300 | $144,700 |
| 2023 | $4,195 | $164,500 | $36,300 | $128,200 |
| 2022 | $3,659 | $164,500 | $36,300 | $128,200 |
| 2021 | $3,091 | $79,400 | $16,300 | $63,100 |
| 2020 | $3,068 | $79,400 | $16,300 | $63,100 |
| 2019 | $1,465 | $79,400 | $16,300 | $63,100 |
| 2018 | $1,465 | $79,400 | $16,300 | $63,100 |
| 2017 | $1,438 | $79,400 | $16,300 | $63,100 |
| 2016 | $2,878 | $79,400 | $16,300 | $63,100 |
| 2015 | -- | $79,400 | $16,300 | $63,100 |
| 2014 | -- | $79,400 | $16,300 | $63,100 |
Source: Public Records
Map
Nearby Homes
Your Personal Tour Guide
Ask me questions while you tour the home.