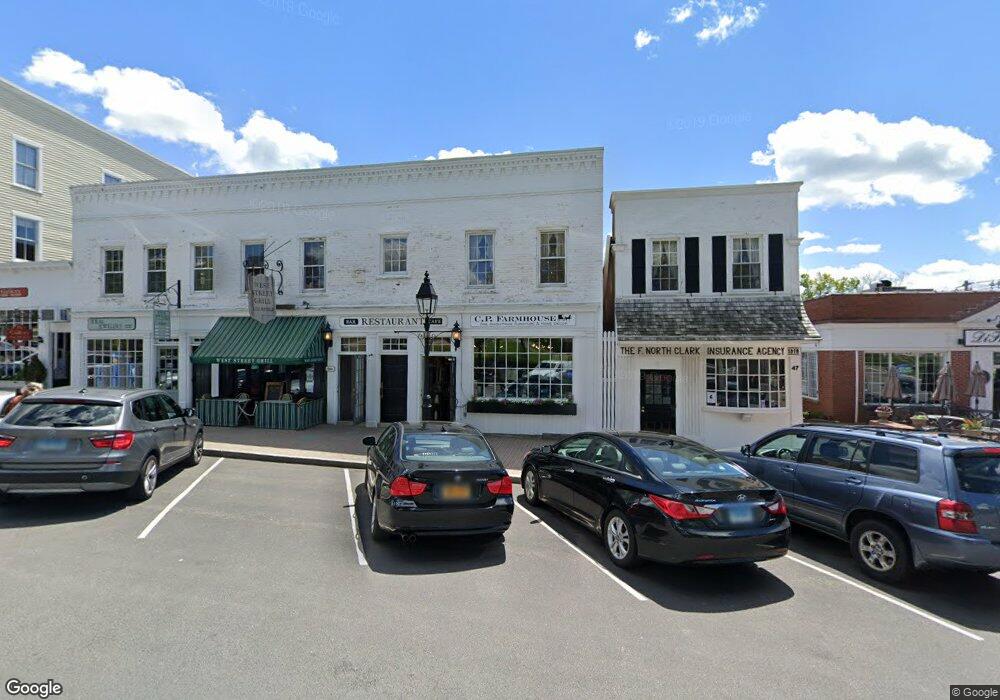
43 West St Litchfield, CT 06759
Estimated Value: $1,818,261
Studio
--
Bath
8,222
Sq Ft
$221/Sq Ft
Est. Value
About This Home
This home is located at 43 West St, Litchfield, CT 06759 and is currently estimated at $1,818,261, approximately $221 per square foot. 43 West St is a home located in Litchfield County with nearby schools including Center School, Litchfield Intermediate School, and Litchfield High School.
Ownership History
Date
Name
Owned For
Owner Type
Purchase Details
Closed on
Sep 9, 2021
Sold by
Macia Properties Llc
Bought by
White Bridge Farm Llc
Current Estimated Value
Purchase Details
Closed on
Jul 19, 2018
Sold by
Phoenix J & J Property L
Bought by
Macia Properties Llc
Home Financials for this Owner
Home Financials are based on the most recent Mortgage that was taken out on this home.
Original Mortgage
$1,041,000
Interest Rate
4.5%
Mortgage Type
Purchase Money Mortgage
Create a Home Valuation Report for This Property
The Home Valuation Report is an in-depth analysis detailing your home's value as well as a comparison with similar homes in the area
Home Values in the Area
Average Home Value in this Area
Purchase History
| Date | Buyer | Sale Price | Title Company |
|---|---|---|---|
| White Bridge Farm Llc | $1,400,000 | None Available | |
| Macia Properties Llc | $1,387,500 | -- |
Source: Public Records
Mortgage History
| Date | Status | Borrower | Loan Amount |
|---|---|---|---|
| Previous Owner | Macia Properties Llc | $1,041,000 |
Source: Public Records
Tax History
| Year | Tax Paid | Tax Assessment Tax Assessment Total Assessment is a certain percentage of the fair market value that is determined by local assessors to be the total taxable value of land and additions on the property. | Land | Improvement |
|---|---|---|---|---|
| 2025 | $22,828 | $1,047,170 | $292,190 | $754,980 |
| 2024 | $21,258 | $1,047,170 | $292,190 | $754,980 |
| 2023 | $26,588 | $910,540 | $249,380 | $661,160 |
| 2022 | $26,861 | $910,540 | $249,380 | $661,160 |
| 2021 | $27,589 | $910,540 | $249,380 | $661,160 |
| 2020 | $27,043 | $910,540 | $249,380 | $661,160 |
| 2019 | $27,498 | $910,540 | $249,380 | $661,160 |
| 2018 | $24,431 | $822,600 | $249,380 | $573,220 |
| 2017 | $24,020 | $822,600 | $249,380 | $573,220 |
| 2016 | $23,280 | $822,600 | $249,380 | $573,220 |
| 2015 | -- | $822,600 | $249,380 | $573,220 |
| 2014 | $21,824 | $822,600 | $249,380 | $573,220 |
Source: Public Records
Map
Nearby Homes
- 44 South St
- 00 Torrington Rd
- 91 North St
- 124 North St
- 137 Old South Rd
- 11 W Chestnut Hill Rd
- 415 South St
- 447 South St
- 374 Torrington Rd
- 184 Fern Ave
- 3 Sally Burr Rd
- 0 Sally Burr Rd
- 700 Bantam Rd
- 29 Roosevelt Ave
- 8 Haley Ln Unit 8
- 161 Circle Dr
- 162 Hunter Dr
- 28 Trumbull St
- 250 Hunter Dr Unit 250
- 258 Hunter Dr Unit 258
Your Personal Tour Guide
Ask me questions while you tour the home.