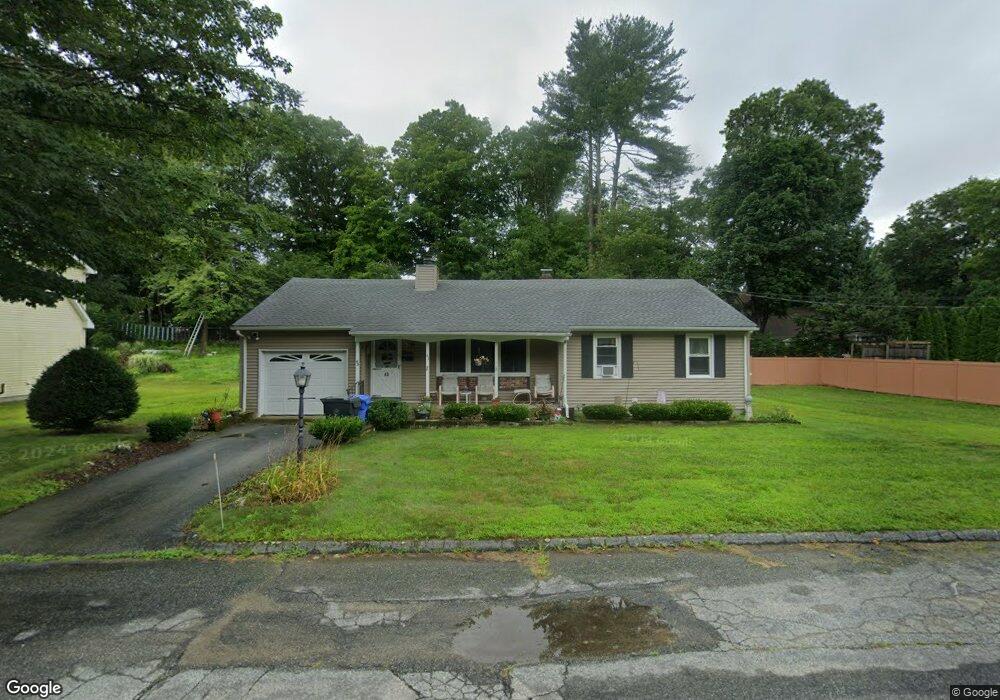
43 Woodward St Danielson, CT 06239
Estimated Value: $319,000 - $346,603
3
Beds
1
Bath
1,309
Sq Ft
$255/Sq Ft
Est. Value
About This Home
This home is located at 43 Woodward St, Danielson, CT 06239 and is currently estimated at $334,401, approximately $255 per square foot. 43 Woodward St is a home located in Windham County with nearby schools including Killingly Central School, Killingly Memorial School, and Killingly Intermediate School.
Ownership History
Date
Name
Owned For
Owner Type
Purchase Details
Closed on
Oct 15, 2019
Sold by
Bernier Elaine H
Bought by
Bernier Linda J
Current Estimated Value
Purchase Details
Closed on
Aug 29, 2016
Sold by
Bernier Elaine H
Bought by
Bernier Linda J and Mason Sandra
Purchase Details
Closed on
Oct 29, 2015
Sold by
Bernier Francis O
Bought by
Bernier Elaine H
Create a Home Valuation Report for This Property
The Home Valuation Report is an in-depth analysis detailing your home's value as well as a comparison with similar homes in the area
Home Values in the Area
Average Home Value in this Area
Purchase History
| Date | Buyer | Sale Price | Title Company |
|---|---|---|---|
| Bernier Linda J | -- | -- | |
| Bernier Linda J | -- | -- | |
| Bernier Elaine H | -- | -- | |
| Bernier Elaine H | -- | -- | |
| Bernier Linda J | -- | -- | |
| Bernier Linda J | -- | -- | |
| Bernier Elaine H | -- | -- | |
| Bernier Elaine H | -- | -- |
Source: Public Records
Tax History Compared to Growth
Tax History
| Year | Tax Paid | Tax Assessment Tax Assessment Total Assessment is a certain percentage of the fair market value that is determined by local assessors to be the total taxable value of land and additions on the property. | Land | Improvement |
|---|---|---|---|---|
| 2025 | $4,439 | $189,280 | $28,950 | $160,330 |
| 2024 | $4,177 | $189,280 | $28,950 | $160,330 |
| 2023 | $3,696 | $129,020 | $24,020 | $105,000 |
| 2022 | $3,492 | $129,780 | $24,780 | $105,000 |
| 2021 | $3,492 | $129,780 | $24,780 | $105,000 |
| 2020 | $3,418 | $129,780 | $24,780 | $105,000 |
| 2019 | $3,486 | $129,780 | $24,780 | $105,000 |
| 2017 | $2,920 | $99,960 | $15,890 | $84,070 |
| 2016 | $2,910 | $99,960 | $15,890 | $84,070 |
| 2015 | $2,930 | $99,960 | $15,890 | $84,070 |
| 2014 | $2,850 | $99,960 | $15,890 | $84,070 |
Source: Public Records
Map
Nearby Homes
- 65 Stone St
- 140 Woodward St
- 17 Hillside Terrace
- 16 James St
- 860 N Main St
- 48 Athol St Unit 48
- 58 Athol St Unit 58
- 78 Athol St
- 69 Peckham Ln
- 409 Main St
- 415 Maple St
- 94 Mechanic St
- 144 Prospect Ave
- 24 Center St
- 133 Maple St
- 10 Conrad's Park
- 61 Deerwood Dr
- 1032 N Main St Unit 9
- 102 Cottage St
- 72 Main St