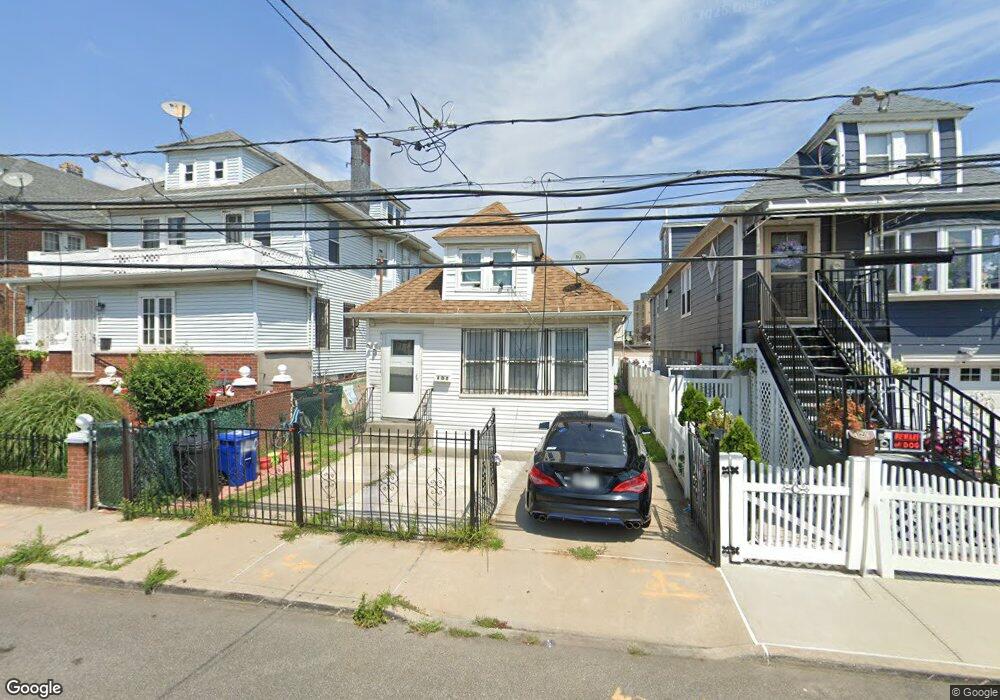
430 Beach 36th St Far Rockaway, NY 11691
Edgemere NeighborhoodEstimated Value: $571,000 - $773,000
--
Bed
--
Bath
2,813
Sq Ft
$226/Sq Ft
Est. Value
About This Home
This home is located at 430 Beach 36th St, Far Rockaway, NY 11691 and is currently estimated at $637,129, approximately $226 per square foot. 430 Beach 36th St is a home located in Queens County with nearby schools including Lighthouse Elementary School, Ms 53 Brian Piccolo, and Q319 Village Academy.
Ownership History
Date
Name
Owned For
Owner Type
Purchase Details
Closed on
Jul 22, 2005
Sold by
Regis Agnes and Ware Milledge Cobb
Bought by
Regis Agnes
Current Estimated Value
Purchase Details
Closed on
Oct 8, 2003
Sold by
Ap Development Llc
Bought by
Cobbware Milledge and Regis Agnes
Home Financials for this Owner
Home Financials are based on the most recent Mortgage that was taken out on this home.
Original Mortgage
$211,678
Interest Rate
5.88%
Mortgage Type
Purchase Money Mortgage
Purchase Details
Closed on
May 21, 2003
Sold by
Thomas-Harrell Norman
Bought by
Ap Development Llc
Purchase Details
Closed on
Jun 28, 2001
Sold by
Bankerstrust Company Of
Bought by
Thomas-Harrell Norman
Home Financials for this Owner
Home Financials are based on the most recent Mortgage that was taken out on this home.
Original Mortgage
$70,000
Interest Rate
7.14%
Purchase Details
Closed on
Jul 1, 1999
Sold by
Va
Bought by
Bankers Trust Company Of California Na and Vendee Mtg Trust 1999-2
Create a Home Valuation Report for This Property
The Home Valuation Report is an in-depth analysis detailing your home's value as well as a comparison with similar homes in the area
Home Values in the Area
Average Home Value in this Area
Purchase History
| Date | Buyer | Sale Price | Title Company |
|---|---|---|---|
| Regis Agnes | -- | -- | |
| Regis Agnes | -- | -- | |
| Cobbware Milledge | $211,678 | -- | |
| Cobbware Milledge | $211,678 | -- | |
| Ap Development Llc | $148,000 | -- | |
| Ap Development Llc | $148,000 | -- | |
| Thomas-Harrell Norman | -- | -- | |
| Thomas-Harrell Norman | -- | -- | |
| Bankers Trust Company Of California Na | $33,000 | Chicago Title | |
| Bankers Trust Company Of California Na | $33,000 | Chicago Title |
Source: Public Records
Mortgage History
| Date | Status | Borrower | Loan Amount |
|---|---|---|---|
| Previous Owner | Cobbware Milledge | $211,678 | |
| Previous Owner | Thomas-Harrell Norman | $70,000 | |
| Closed | Regis Agnes | $0 |
Source: Public Records
Tax History Compared to Growth
Tax History
| Year | Tax Paid | Tax Assessment Tax Assessment Total Assessment is a certain percentage of the fair market value that is determined by local assessors to be the total taxable value of land and additions on the property. | Land | Improvement |
|---|---|---|---|---|
| 2025 | $1,604 | $9,492 | $2,393 | $7,099 |
| 2024 | $1,616 | $9,384 | $2,438 | $6,946 |
| 2023 | $1,503 | $8,881 | $2,410 | $6,471 |
| 2022 | $1,386 | $26,880 | $8,760 | $18,120 |
| 2021 | $1,370 | $24,540 | $8,760 | $15,780 |
| 2020 | $1,378 | $24,540 | $8,760 | $15,780 |
| 2019 | $1,343 | $27,000 | $8,760 | $18,240 |
| 2018 | $1,211 | $7,401 | $2,960 | $4,441 |
| 2017 | $1,124 | $6,984 | $3,147 | $3,837 |
| 2016 | $1,009 | $6,984 | $3,147 | $3,837 |
| 2015 | $575 | $6,592 | $3,269 | $3,323 |
| 2014 | $575 | $6,517 | $3,232 | $3,285 |
Source: Public Records
Map
Nearby Homes
- 310 Beach 39th St
- 514 Beach 32nd St
- 622 Bay 32 St
- 40-06 Rockaway Beach Blvd
- 29-64 Falcon Ave
- 31-08 Seagirt Ave
- 2918 Beach Channel Dr
- 318 Beach 42nd St
- 3012 Seagirt Ave
- 4-30 Beach 43rd St
- 431 Beach 43rd St
- 2810 Brookhaven Ave
- 579 Beach 43rd St
- 445 Beach 44th St
- 1051 Bay 32nd St
- 171 Beach 29th St
- 2711 Deerfield Rd
- 515 Beach 43rd St
- 538 Beach 43rd St
- 441 B 45 St
- 434 Beach 36th St
- 428 Beach 36th St
- 436 Beach 36th St
- 422 Beach 36th St
- 431 Beach 35th St
- 431 Beach 35th St Unit 2 Fl
- 431 Beach 35th St Unit 2nd fl
- 440 Beach 36th St
- 427 Beach 35th St
- 418 Beach 36th St
- 423 Beach 35th St
- 441 Beach 35th St
- 443 Beach 35th St
- 421 Beach 35th St
- 414 Beach 36th St
- 433 Beach 36th St
- 4-43A Beach 35th St
- 427 Beach 36th St
- 431 Beach 36th St
- 417 Beach 35th St