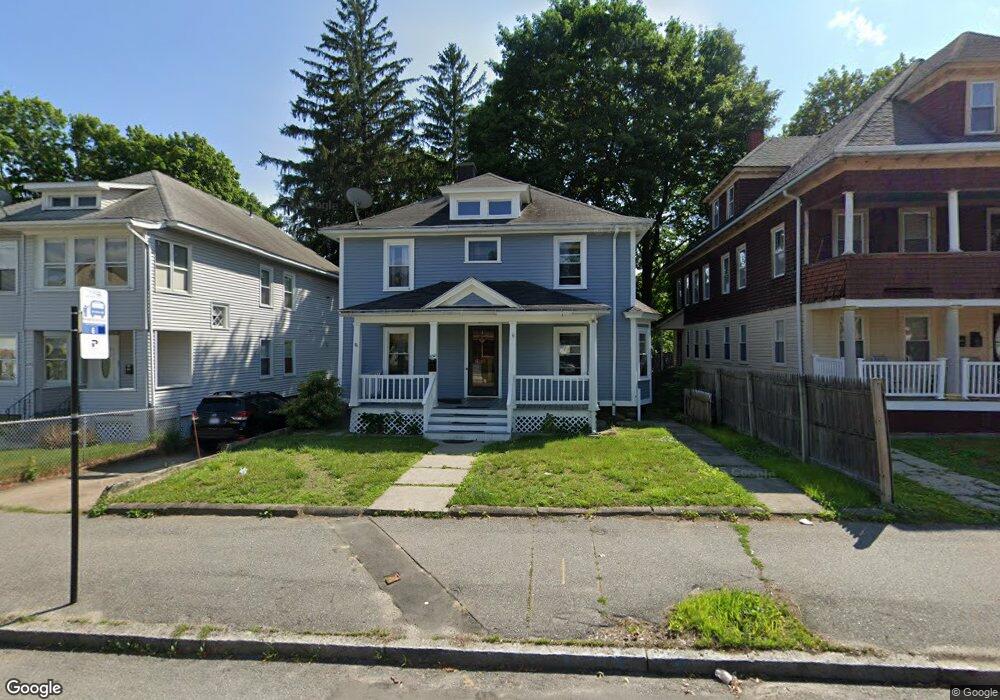
430 Chandler St Worcester, MA 01602
Newton Square NeighborhoodEstimated Value: $436,090 - $448,000
4
Beds
2
Baths
1,628
Sq Ft
$271/Sq Ft
Est. Value
About This Home
This home is located at 430 Chandler St, Worcester, MA 01602 and is currently estimated at $441,773, approximately $271 per square foot. 430 Chandler St is a home located in Worcester County with nearby schools including Chandler Magnet, Jacob Hiatt Magnet School, and May Street Elementary School.
Ownership History
Date
Name
Owned For
Owner Type
Purchase Details
Closed on
Mar 10, 2004
Sold by
Charchaflian Mickael
Bought by
Aprahamian Arpi and Charchaflian Arpi
Current Estimated Value
Home Financials for this Owner
Home Financials are based on the most recent Mortgage that was taken out on this home.
Original Mortgage
$60,000
Outstanding Balance
$28,041
Interest Rate
5.67%
Mortgage Type
Purchase Money Mortgage
Estimated Equity
$413,732
Purchase Details
Closed on
Aug 6, 1999
Sold by
Bahnan Tony B
Bought by
Charchaflian Michael and Charchaflian Arpi
Purchase Details
Closed on
Oct 6, 1989
Sold by
Michael Hersel
Bought by
Bahnan Tony
Home Financials for this Owner
Home Financials are based on the most recent Mortgage that was taken out on this home.
Original Mortgage
$94,400
Interest Rate
10.12%
Mortgage Type
Purchase Money Mortgage
Create a Home Valuation Report for This Property
The Home Valuation Report is an in-depth analysis detailing your home's value as well as a comparison with similar homes in the area
Home Values in the Area
Average Home Value in this Area
Purchase History
| Date | Buyer | Sale Price | Title Company |
|---|---|---|---|
| Aprahamian Arpi | $130,000 | -- | |
| Charchaflian Michael | $130,000 | -- | |
| Bahnan Tony | $118,000 | -- |
Source: Public Records
Mortgage History
| Date | Status | Borrower | Loan Amount |
|---|---|---|---|
| Open | Aprahamian Arpi | $60,000 | |
| Previous Owner | Bahnan Tony | $94,400 |
Source: Public Records
Tax History Compared to Growth
Tax History
| Year | Tax Paid | Tax Assessment Tax Assessment Total Assessment is a certain percentage of the fair market value that is determined by local assessors to be the total taxable value of land and additions on the property. | Land | Improvement |
|---|---|---|---|---|
| 2025 | $4,478 | $339,500 | $97,900 | $241,600 |
| 2024 | $4,390 | $319,300 | $97,900 | $221,400 |
| 2023 | $4,213 | $293,800 | $85,100 | $208,700 |
| 2022 | $3,883 | $255,300 | $68,100 | $187,200 |
| 2021 | $3,748 | $230,200 | $54,500 | $175,700 |
| 2020 | $3,636 | $213,900 | $54,500 | $159,400 |
| 2019 | $3,499 | $194,400 | $49,000 | $145,400 |
| 2018 | $3,479 | $184,000 | $49,000 | $135,000 |
| 2017 | $3,348 | $174,200 | $49,000 | $125,200 |
| 2016 | $3,324 | $161,300 | $36,400 | $124,900 |
| 2015 | $3,237 | $161,300 | $36,400 | $124,900 |
| 2014 | $3,132 | $160,300 | $36,400 | $123,900 |
Source: Public Records
Map
Nearby Homes
- 432 Chandler St
- 428 Chandler St
- 434 Chandler St
- 8 Hartshorn Ave
- 8 Hartshorn Ave Unit 1
- 426 Chandler St
- 10 Hartshorn Ave
- 6 Hartshorn Ave
- 424 Chandler St
- 424 Chandler St Unit 1
- 12 Hartshorn Ave
- 12 Hartshorn Ave Unit 1
- 12 Hartshorn Ave Unit 2
- 12 Hartshorn Ave Unit 3
- 436 Chandler St
- 429 Chandler St
- 431 Chandler St
- 431 Chandler St Unit 1
- 4 Hartshorn Ave
- 4 Hartshorn Ave Unit 1