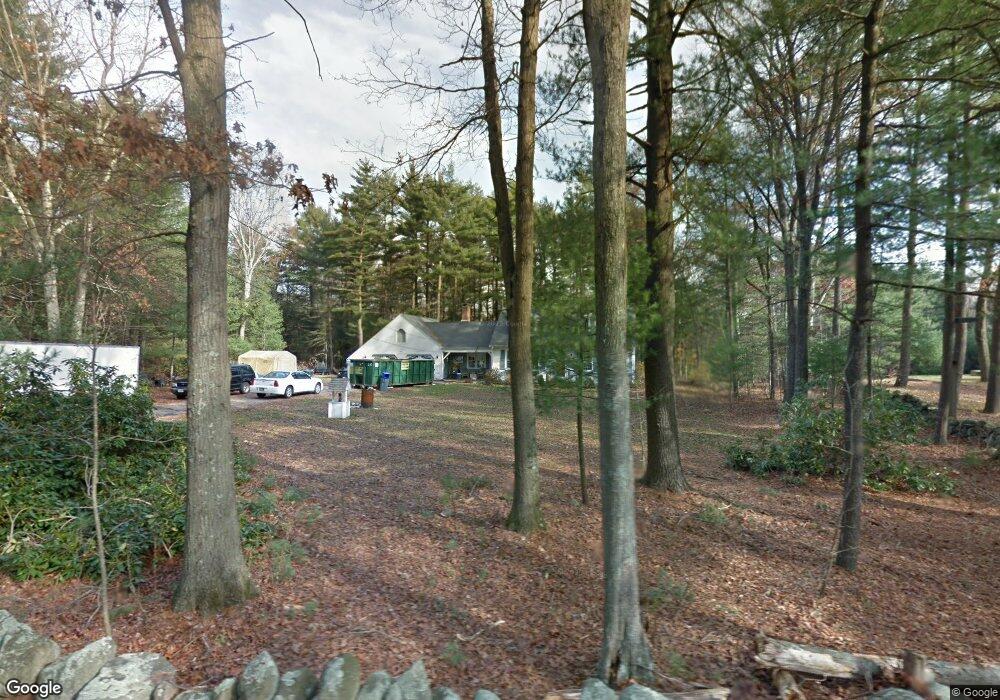
430 Chestnut St Wrentham, MA 02093
Sheldonville NeighborhoodEstimated Value: $709,000 - $779,000
3
Beds
2
Baths
2,054
Sq Ft
$357/Sq Ft
Est. Value
About This Home
This home is located at 430 Chestnut St, Wrentham, MA 02093 and is currently estimated at $733,183, approximately $356 per square foot. 430 Chestnut St is a home located in Norfolk County with nearby schools including Delaney Elementary School and Charles E Roderick.
Ownership History
Date
Name
Owned For
Owner Type
Purchase Details
Closed on
May 15, 2006
Sold by
Constantineau Daniel and Constantineau Donet P
Bought by
Monroe Mark
Current Estimated Value
Home Financials for this Owner
Home Financials are based on the most recent Mortgage that was taken out on this home.
Original Mortgage
$250,000
Outstanding Balance
$144,789
Interest Rate
6.4%
Mortgage Type
Purchase Money Mortgage
Estimated Equity
$588,394
Create a Home Valuation Report for This Property
The Home Valuation Report is an in-depth analysis detailing your home's value as well as a comparison with similar homes in the area
Home Values in the Area
Average Home Value in this Area
Purchase History
| Date | Buyer | Sale Price | Title Company |
|---|---|---|---|
| Monroe Mark | $425,000 | -- |
Source: Public Records
Mortgage History
| Date | Status | Borrower | Loan Amount |
|---|---|---|---|
| Open | Monroe Mark | $250,000 |
Source: Public Records
Tax History Compared to Growth
Tax History
| Year | Tax Paid | Tax Assessment Tax Assessment Total Assessment is a certain percentage of the fair market value that is determined by local assessors to be the total taxable value of land and additions on the property. | Land | Improvement |
|---|---|---|---|---|
| 2025 | $7,272 | $627,400 | $293,400 | $334,000 |
| 2024 | $7,064 | $588,700 | $293,400 | $295,300 |
| 2023 | $6,914 | $547,900 | $266,700 | $281,200 |
| 2022 | $6,179 | $452,000 | $212,000 | $240,000 |
| 2021 | $5,736 | $407,700 | $179,600 | $228,100 |
| 2020 | $5,265 | $369,500 | $148,600 | $220,900 |
| 2019 | $5,294 | $374,900 | $165,100 | $209,800 |
| 2018 | $5,326 | $374,000 | $165,300 | $208,700 |
| 2017 | $4,970 | $348,800 | $162,100 | $186,700 |
| 2016 | $4,895 | $342,800 | $157,400 | $185,400 |
| 2015 | $4,705 | $314,100 | $151,300 | $162,800 |
| 2014 | $4,628 | $302,300 | $145,500 | $156,800 |
Source: Public Records
Map
Nearby Homes
- 440 Chestnut St
- 955 Summer St
- 6 Woodchester Rd
- 80 Carriage House Ln
- 0 Fall Ln
- 55 Lawrence Dr Unit 55
- 50 Green St
- 29 Lawrence Dr
- 732 King St
- 791 South St Unit 5
- 82 Uncas Ave Unit 1
- 70 Uncas Ave
- 64 Uncas Ave
- Lot 1 - Blueberry 2 Car Plan at King Philip Estates
- Lot 8 - Blueberry 2 Car Plan at King Philip Estates
- Lot 5 - Hughes 2 car Plan at King Philip Estates
- Lot 6 - Blueberry 3 Car Plan at King Philip Estates
- Lot 2 - Camden 2 Car Plan at King Philip Estates
- Lot 7 - Cedar Plan at King Philip Estates
- Lot 4 - Hemingway 2 Car Plan at King Philip Estates
- 400 Chestnut St
- 425 Chestnut St
- 450 Chestnut St
- 435 Chestnut St
- 445 Chestnut St
- 380 Chestnut St
- 415 Chestnut St
- 460 Chestnut St
- 455 Chestnut St
- 360 Chestnut St
- 405 Chestnut St
- 358 Chestnut St
- 475 Chestnut St
- 391 Chestnut St
- 32 Mount St
- 500 Chestnut St
- 356 Chestnut St
- 13 Birch St
- 381 Chestnut St
- 31 Mount St