S
Landlord's Agent in 2025
Sara Moore
Drake Realty of GA, Inc.
(770) 856-7171
15 Total Sales
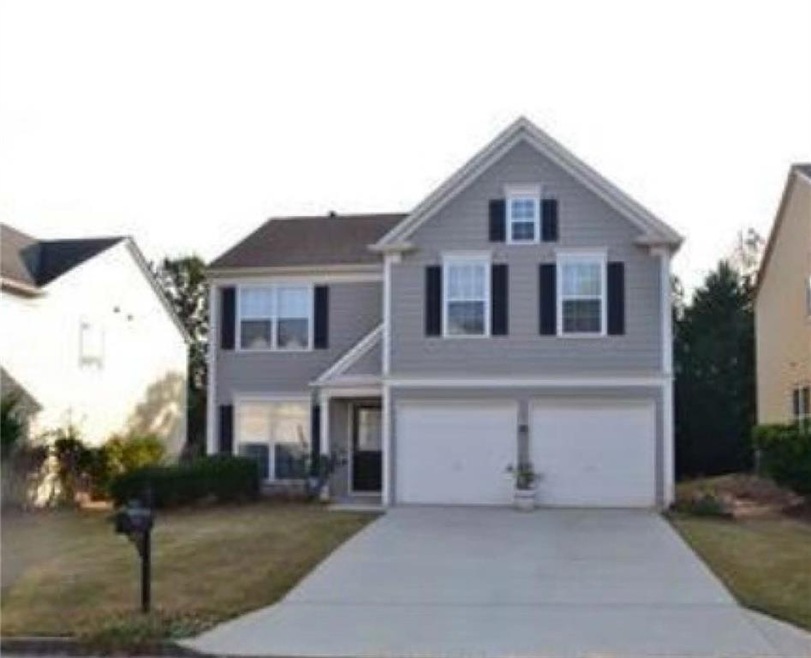
Beautiful Open floor plan, new paint, hard wood on main level, laminate floors second level. bright . great private fenced in backyard. Top Chattahoochee High School district. Open floor pan with two story living room on the main. Swim, tennis, playground close to shopping and restaurants in Johns Creek.
Last Agent to Rent the Property
Drake Realty of GA, Inc. License #339948 Listed on: 04/07/2025

| Date | Buyer | Sale Price | Title Company |
|---|---|---|---|
| Miraliakbari Zohreh | $173,300 | -- | |
| Chang Yousong | $136,100 | -- |
| Date | Status | Borrower | Loan Amount |
|---|---|---|---|
| Previous Owner | Miraliakbari Zohreh | $90,050 | |
| Closed | Chang Yousong | -- |
| Date | Event | Price | Change | Sq Ft Price |
|---|---|---|---|---|
| 04/25/2025 04/25/25 | Rented | $2,750 | +5.8% | -- |
| 04/07/2025 04/07/25 | For Rent | $2,600 | +2.0% | -- |
| 10/31/2024 10/31/24 | Rented | $2,550 | 0.0% | -- |
| 10/19/2024 10/19/24 | Under Contract | -- | -- | -- |
| 10/12/2024 10/12/24 | For Rent | $2,550 | +41.7% | -- |
| 12/27/2018 12/27/18 | Rented | $1,800 | 0.0% | -- |
| 12/14/2018 12/14/18 | Under Contract | -- | -- | -- |
| 11/06/2018 11/06/18 | For Rent | $1,800 | +5.9% | -- |
| 12/11/2016 12/11/16 | Rented | $1,700 | 0.0% | -- |
| 11/29/2016 11/29/16 | Under Contract | -- | -- | -- |
| 11/15/2016 11/15/16 | Price Changed | $1,700 | +3.0% | $1 / Sq Ft |
| 11/14/2016 11/14/16 | For Rent | $1,650 | -- | -- |
| Year | Tax Paid | Tax Assessment Tax Assessment Total Assessment is a certain percentage of the fair market value that is determined by local assessors to be the total taxable value of land and additions on the property. | Land | Improvement |
|---|---|---|---|---|
| 2025 | $6,252 | $217,800 | $54,440 | $163,360 |
| 2023 | $6,252 | $177,120 | $37,560 | $139,560 |
| 2022 | $4,193 | $136,640 | $28,920 | $107,720 |
| 2021 | $3,749 | $119,000 | $25,520 | $93,480 |
| 2020 | $4,085 | $126,920 | $27,160 | $99,760 |
| 2019 | $492 | $124,680 | $26,680 | $98,000 |
| 2018 | $2,702 | $98,760 | $18,920 | $79,840 |
| 2017 | $2,532 | $86,920 | $17,040 | $69,880 |
| 2016 | $2,475 | $86,920 | $17,040 | $69,880 |
| 2015 | $2,501 | $86,920 | $17,040 | $69,880 |
| 2014 | $2,110 | $72,880 | $17,360 | $55,520 |
S
Landlord's Agent in 2025
Sara Moore
Drake Realty of GA, Inc.
(770) 856-7171
15 Total Sales
Tenant's Agent in 2025
Ken Tamura
Keller Williams Realty Chattahoochee North, LLC
(770) 403-9242
19 Total Sales
Buyer's Agent in 2024
Emily Holbrook Mattison
Real Broker, LLC.
(706) 903-8478
70 Total Sales
H
Seller's Agent in 2018
Holly Niakan
Keller Williams Rlty, First Atlanta
(678) 907-8503
12 Total Sales
A
Buyer's Agent in 2016
Alisa Hudzina
NOT A VALID MEMBER
Source: First Multiple Listing Service (FMLS)
MLS Number: 7555095
APN: 11-0770-0311-213-8
Disclaimer: Certain information contained herein is derived from information provided by parties other than Homes.com. All information provided is deemed reliable, but is not guaranteed to be accurate and should be independently verified.
![]() Listings identified with the FMLS IDX logo come from FMLS and are held by brokerage firms other than the owner of this website. The listing brokerage is identified in any listing details. Information is deemed reliable but is not guaranteed. If you believe any FMLS listing contains material that infringes your copyrighted work please visit www.fmls.com/dmca to review our DMCA policy and learn how to submit a takedown request. © 2025 First Multiple Listing Service, Inc.
Listings identified with the FMLS IDX logo come from FMLS and are held by brokerage firms other than the owner of this website. The listing brokerage is identified in any listing details. Information is deemed reliable but is not guaranteed. If you believe any FMLS listing contains material that infringes your copyrighted work please visit www.fmls.com/dmca to review our DMCA policy and learn how to submit a takedown request. © 2025 First Multiple Listing Service, Inc.