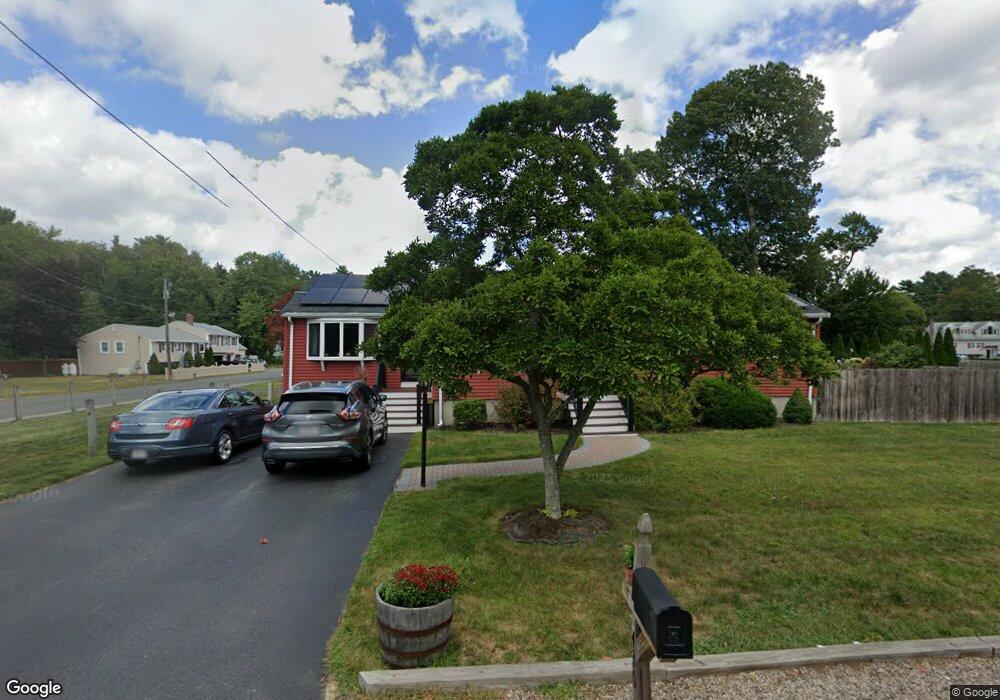
430 Concord St Rockland, MA 02370
Estimated Value: $547,000 - $619,000
3
Beds
2
Baths
1,351
Sq Ft
$435/Sq Ft
Est. Value
About This Home
This home is located at 430 Concord St, Rockland, MA 02370 and is currently estimated at $587,188, approximately $434 per square foot. 430 Concord St is a home located in Plymouth County with nearby schools including Rockland Senior High School, Calvary Chapel Academy, and Holy Family Elementary School.
Ownership History
Date
Name
Owned For
Owner Type
Purchase Details
Closed on
Oct 25, 1999
Sold by
Chittick Joseph J and Chittick Maureen
Bought by
Mcgivney Dana J and Mcgivney Lori M
Current Estimated Value
Purchase Details
Closed on
Jul 21, 1993
Sold by
Grindall Bruce C and Grindall Cynthia S
Bought by
Chittick Joseph J and Chittick Maureen
Create a Home Valuation Report for This Property
The Home Valuation Report is an in-depth analysis detailing your home's value as well as a comparison with similar homes in the area
Home Values in the Area
Average Home Value in this Area
Purchase History
| Date | Buyer | Sale Price | Title Company |
|---|---|---|---|
| Mcgivney Dana J | $194,000 | -- | |
| Chittick Joseph J | $144,500 | -- |
Source: Public Records
Mortgage History
| Date | Status | Borrower | Loan Amount |
|---|---|---|---|
| Open | Chittick Joseph J | $280,000 | |
| Closed | Chittick Joseph J | $70,000 | |
| Closed | Chittick Joseph J | $14,500 |
Source: Public Records
Tax History Compared to Growth
Tax History
| Year | Tax Paid | Tax Assessment Tax Assessment Total Assessment is a certain percentage of the fair market value that is determined by local assessors to be the total taxable value of land and additions on the property. | Land | Improvement |
|---|---|---|---|---|
| 2025 | $6,936 | $507,400 | $217,700 | $289,700 |
| 2024 | $6,735 | $479,000 | $205,300 | $273,700 |
| 2023 | $6,851 | $450,100 | $198,300 | $251,800 |
| 2022 | $6,616 | $395,000 | $172,400 | $222,600 |
| 2021 | $6,100 | $353,000 | $156,700 | $196,300 |
| 2020 | $5,933 | $339,000 | $149,300 | $189,700 |
| 2019 | $5,838 | $325,800 | $142,200 | $183,600 |
| 2018 | $5,426 | $297,800 | $142,200 | $155,600 |
| 2017 | $5,263 | $284,800 | $142,200 | $142,600 |
| 2016 | $5,063 | $273,800 | $136,700 | $137,100 |
| 2015 | $4,845 | $254,600 | $127,800 | $126,800 |
| 2014 | $4,583 | $249,900 | $125,300 | $124,600 |
Source: Public Records
Map
Nearby Homes
- 810 Brookline Way
- 19 Pat Rose Way
- 8 Pat Rose Way
- 6 Pat Rose Way
- 17 Pat Rose Way
- 20 Pat Rose Way
- 696 Summer St
- 149 Concord St
- 86 Damon Rd
- 14 Daniel Teague Dr
- 38 Levin Rd
- 133 Spring St
- 718 Market St
- 440 Market St
- 49 Liberty St
- 133 Crescent St
- 92 Liberty St
- 94-96 Crescent St
- 140 W Water St
- 12 Linden St