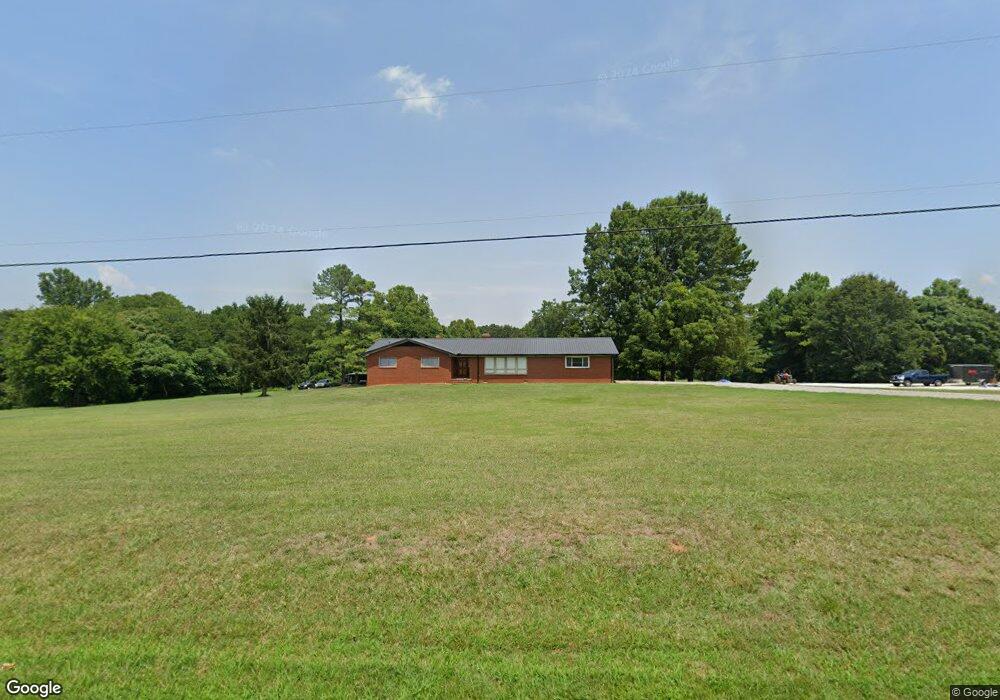
430 Cooper Rd Salisbury, NC 28147
Estimated Value: $92,000 - $388,000
Studio
1
Bath
1,933
Sq Ft
$122/Sq Ft
Est. Value
About This Home
This home is located at 430 Cooper Rd, Salisbury, NC 28147 and is currently estimated at $235,388, approximately $121 per square foot. 430 Cooper Rd is a home located in Rowan County with nearby schools including Millbridge Elementary School, Southeast Middle School, and West Rowan High School.
Ownership History
Date
Name
Owned For
Owner Type
Purchase Details
Closed on
Aug 10, 2021
Sold by
Upright Todd Randall and Upright Rhonda Sellers
Bought by
Leonard Ryan A and Upright Mckenzie M
Current Estimated Value
Home Financials for this Owner
Home Financials are based on the most recent Mortgage that was taken out on this home.
Original Mortgage
$152,000
Outstanding Balance
$138,726
Interest Rate
3.15%
Mortgage Type
New Conventional
Estimated Equity
$96,662
Purchase Details
Closed on
Jan 22, 2004
Sold by
Upright Todd R and Upright Rhonda S
Bought by
Collins Bobby Franklin
Home Financials for this Owner
Home Financials are based on the most recent Mortgage that was taken out on this home.
Original Mortgage
$26,000
Interest Rate
5.13%
Mortgage Type
Purchase Money Mortgage
Create a Home Valuation Report for This Property
The Home Valuation Report is an in-depth analysis detailing your home's value as well as a comparison with similar homes in the area
Purchase History
| Date | Buyer | Sale Price | Title Company |
|---|---|---|---|
| Leonard Ryan A | $150,000 | None Available | |
| Collins Bobby Franklin | $35,000 | -- |
Source: Public Records
Mortgage History
| Date | Status | Borrower | Loan Amount |
|---|---|---|---|
| Open | Leonard Ryan A | $152,000 | |
| Previous Owner | Collins Bobby Franklin | $26,000 | |
| Closed | Collins Bobby Franklin | $7,000 |
Source: Public Records
Tax History
| Year | Tax Paid | Tax Assessment Tax Assessment Total Assessment is a certain percentage of the fair market value that is determined by local assessors to be the total taxable value of land and additions on the property. | Land | Improvement |
|---|---|---|---|---|
| 2025 | $848 | $125,221 | $118,711 | $6,510 |
| 2024 | $848 | $125,221 | $118,711 | $6,510 |
| 2023 | $848 | $125,221 | $118,711 | $6,510 |
| 2022 | $870 | $115,190 | $111,890 | $3,300 |
| 2021 | $1,836 | $245,607 | $115,946 | $129,661 |
| 2020 | $1,836 | $245,607 | $115,946 | $129,661 |
| 2019 | $1,836 | $245,607 | $115,946 | $129,661 |
| 2018 | $1,688 | $227,780 | $115,945 | $111,835 |
| 2017 | $1,688 | $227,780 | $115,945 | $111,835 |
| 2016 | $1,505 | $203,016 | $93,181 | $109,835 |
| 2015 | $862 | $203,016 | $93,181 | $109,835 |
| 2014 | $859 | $202,990 | $87,956 | $115,034 |
Source: Public Records
Map
Nearby Homes
- 895 Cooper Rd
- 2740 Hill Top Dr
- 1910 Cooper Rd
- 4115 Miller Rd
- 143 Maple Ridge Cir
- 1298 Timber Spring Ln
- 328 Bramblewood Dr
- 462 Cress Loop Rd
- 397 Bramblewood Dr Unit 50
- 1520 Weaver Rd
- 2340 Patterson Rd
- 130 Lois Ln
- 1348 Greenheather Dr
- 1188 Cobblestone Dr
- 0 Patrick Dr
- 1724 Barnhardt Rd
- 1734 Barnhardt Rd
- 1325 Coppergate Dr
- 152 Old Bailey Ct
- 1135 Stonegate Dr
Your Personal Tour Guide
Ask me questions while you tour the home.