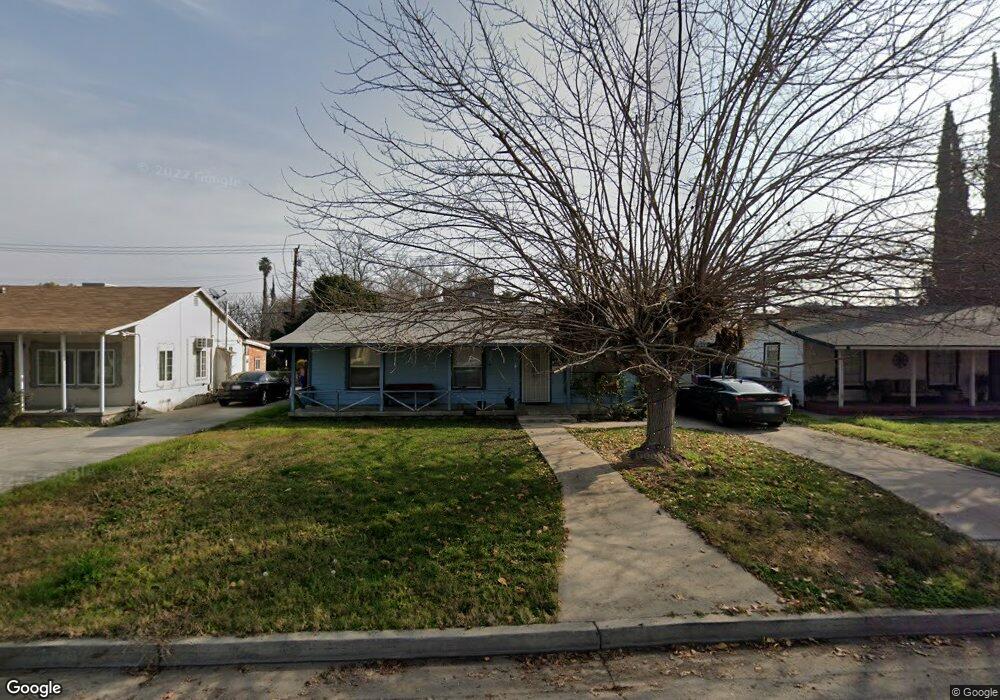
430 Cypress St Bakersfield, CA 93304
Oleander-Sunset NeighborhoodEstimated Value: $240,376 - $274,000
2
Beds
1
Bath
894
Sq Ft
$290/Sq Ft
Est. Value
About This Home
This home is located at 430 Cypress St, Bakersfield, CA 93304 and is currently estimated at $259,344, approximately $290 per square foot. 430 Cypress St is a home located in Kern County with nearby schools including William Penn Elementary School, Emerson Middle School, and Bakersfield High School.
Ownership History
Date
Name
Owned For
Owner Type
Purchase Details
Closed on
May 12, 2008
Sold by
Deutsche Bank National Trust Co
Bought by
Fitzsimmons Brian
Current Estimated Value
Home Financials for this Owner
Home Financials are based on the most recent Mortgage that was taken out on this home.
Original Mortgage
$109,011
Outstanding Balance
$69,000
Interest Rate
5.87%
Mortgage Type
FHA
Estimated Equity
$190,344
Purchase Details
Closed on
Oct 31, 2007
Sold by
Lopez Vincent Ben
Bought by
Deutsche Bank National Trust Co and Morgan Stanley Abs Capital I Inc Trust 2
Create a Home Valuation Report for This Property
The Home Valuation Report is an in-depth analysis detailing your home's value as well as a comparison with similar homes in the area
Home Values in the Area
Average Home Value in this Area
Purchase History
| Date | Buyer | Sale Price | Title Company |
|---|---|---|---|
| Fitzsimmons Brian | $110,000 | Commonwealth | |
| Deutsche Bank National Trust Co | $212,000 | Accommodation |
Source: Public Records
Mortgage History
| Date | Status | Borrower | Loan Amount |
|---|---|---|---|
| Open | Fitzsimmons Brian | $109,011 |
Source: Public Records
Tax History
| Year | Tax Paid | Tax Assessment Tax Assessment Total Assessment is a certain percentage of the fair market value that is determined by local assessors to be the total taxable value of land and additions on the property. | Land | Improvement |
|---|---|---|---|---|
| 2025 | $2,291 | $144,469 | $52,532 | $91,937 |
| 2024 | $2,238 | $141,637 | $51,502 | $90,135 |
| 2023 | $2,238 | $138,861 | $50,493 | $88,368 |
| 2022 | $2,179 | $136,139 | $49,503 | $86,636 |
| 2021 | $2,072 | $133,471 | $48,533 | $84,938 |
| 2020 | $2,035 | $132,104 | $48,036 | $84,068 |
| 2019 | $1,994 | $132,104 | $48,036 | $84,068 |
| 2018 | $1,936 | $126,000 | $32,000 | $94,000 |
| 2017 | $1,843 | $117,000 | $29,000 | $88,000 |
| 2016 | $1,536 | $100,000 | $25,000 | $75,000 |
| 2015 | $1,449 | $92,000 | $23,000 | $69,000 |
| 2014 | $1,343 | $85,000 | $21,000 | $64,000 |
Source: Public Records
Map
Nearby Homes
- 622 Cypress St
- 416 Beech St
- 412 Beech St
- 2731 Dracena St
- 2730 Buena Vista St
- 340 Oakdale Dr
- 2709 Sunset Ave
- 236 Oakdale Dr
- 340 Western Dr
- 2714 Sunset Ave
- 625 A St
- 2416 Chester Ln
- 3301 Bank St
- 2901 California Ave
- 139 Spruce St
- 129 Beech St
- 2709 California Ave
- 501 B St
- 115 Cypress St
- 619 Palo Verde St
Your Personal Tour Guide
Ask me questions while you tour the home.