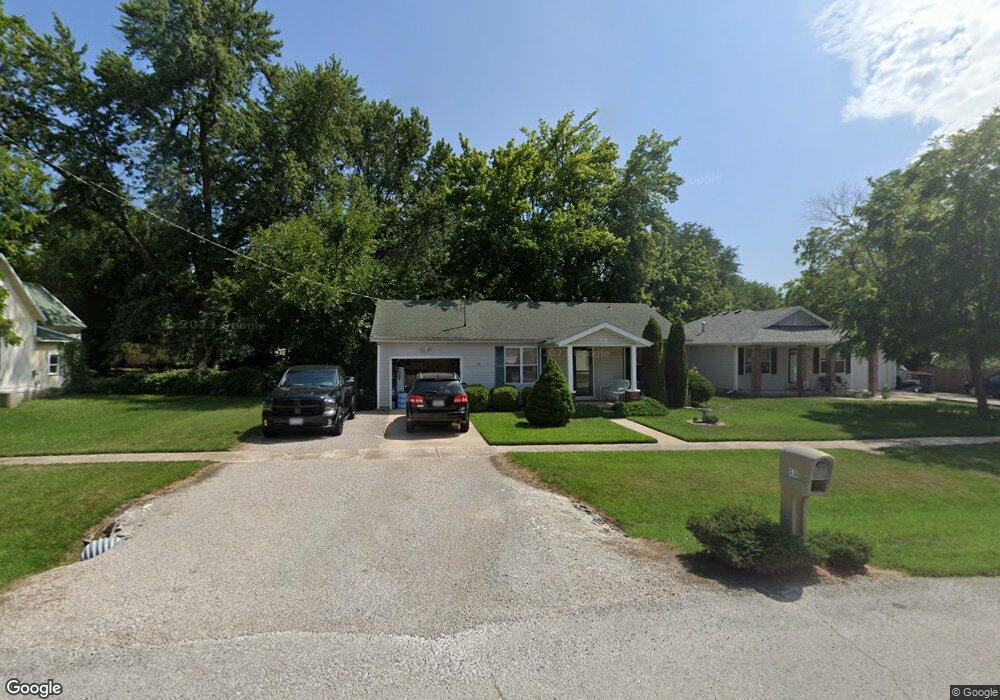
430 E 2nd St Marshfield, MO 65706
Estimated Value: $195,000 - $204,000
Studio
--
Bath
1,128
Sq Ft
$178/Sq Ft
Est. Value
About This Home
This home is located at 430 E 2nd St, Marshfield, MO 65706 and is currently estimated at $200,565, approximately $177 per square foot. 430 E 2nd St is a home located in Webster County with nearby schools including Edwin P. Hubble Elementary School, Shook Elementary School, and Daniel Webster Elementary School.
Ownership History
Date
Name
Owned For
Owner Type
Purchase Details
Closed on
Nov 10, 2025
Sold by
Lukenbill Trenton Douglas and Lukenbill Haley
Bought by
Wright Cherice
Current Estimated Value
Home Financials for this Owner
Home Financials are based on the most recent Mortgage that was taken out on this home.
Original Mortgage
$180,000
Outstanding Balance
$180,000
Interest Rate
6.34%
Mortgage Type
New Conventional
Estimated Equity
$20,565
Purchase Details
Closed on
Oct 30, 2020
Sold by
Young Jessica L
Bought by
Lukenbill Trenton Douglas
Create a Home Valuation Report for This Property
The Home Valuation Report is an in-depth analysis detailing your home's value as well as a comparison with similar homes in the area
Home Values in the Area
Average Home Value in this Area
Purchase History
| Date | Buyer | Sale Price | Title Company |
|---|---|---|---|
| Wright Cherice | -- | None Listed On Document | |
| Lukenbill Trenton Douglas | -- | -- |
Source: Public Records
Mortgage History
| Date | Status | Borrower | Loan Amount |
|---|---|---|---|
| Open | Wright Cherice | $180,000 |
Source: Public Records
Tax History
| Year | Tax Paid | Tax Assessment Tax Assessment Total Assessment is a certain percentage of the fair market value that is determined by local assessors to be the total taxable value of land and additions on the property. | Land | Improvement |
|---|---|---|---|---|
| 2025 | $10,254 | $15,470 | $0 | $0 |
| 2024 | $793 | $13,680 | $0 | $0 |
| 2023 | $770 | $13,680 | $0 | $0 |
| 2022 | $771 | $13,680 | $0 | $0 |
| 2021 | $770 | $13,680 | $0 | $0 |
| 2020 | $691 | $12,520 | $0 | $0 |
| 2019 | $655 | $12,520 | $0 | $0 |
| 2018 | $655 | $12,520 | $0 | $0 |
| 2017 | $542 | $12,370 | $0 | $0 |
| 2016 | $542 | $11,460 | $0 | $0 |
| 2015 | $536 | $11,460 | $0 | $0 |
| 2012 | -- | $11,460 | $0 | $0 |
Source: Public Records
Map
Nearby Homes
- 520 S Pine St
- 256 E 2nd St
- 529 E Mcvay St
- 252 Commercial St
- 314 E Jackson St
- 438 E Madison St
- 537 S Walnut St
- Tbd S Marshall St
- 252 Elizabeth St
- 529 S Clay St
- 259 E Jefferson St
- 705 E Washington St
- 112 N Vine St
- 318 W Jackson St
- 964 Joann St
- 504 E Burford St
- 440 S White Oak Rd
- 720 E Burford St
- 359 E Bedford St
- 424 N Clay St
Your Personal Tour Guide
Ask me questions while you tour the home.