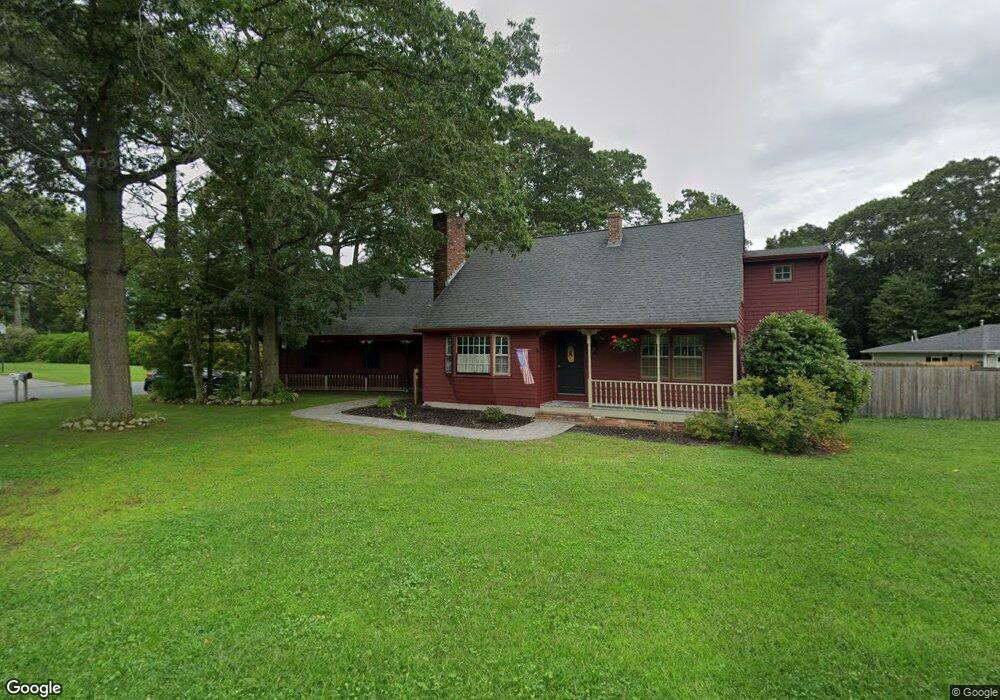
430 Gifford Rd Westport, MA 02790
North Westport NeighborhoodEstimated Value: $550,000 - $707,000
3
Beds
1
Bath
2,616
Sq Ft
$236/Sq Ft
Est. Value
About This Home
This home is located at 430 Gifford Rd, Westport, MA 02790 and is currently estimated at $617,906, approximately $236 per square foot. 430 Gifford Rd is a home located in Bristol County with nearby schools including Alice A. Macomber Primary School, Westport Elementary School, and Westport Middle-High School.
Ownership History
Date
Name
Owned For
Owner Type
Purchase Details
Closed on
Dec 5, 1988
Sold by
Henriques Michael A
Bought by
Ross Wayne A
Current Estimated Value
Home Financials for this Owner
Home Financials are based on the most recent Mortgage that was taken out on this home.
Original Mortgage
$100,000
Interest Rate
10.19%
Mortgage Type
Purchase Money Mortgage
Create a Home Valuation Report for This Property
The Home Valuation Report is an in-depth analysis detailing your home's value as well as a comparison with similar homes in the area
Home Values in the Area
Average Home Value in this Area
Purchase History
| Date | Buyer | Sale Price | Title Company |
|---|---|---|---|
| Ross Wayne A | $140,000 | -- |
Source: Public Records
Mortgage History
| Date | Status | Borrower | Loan Amount |
|---|---|---|---|
| Open | Ross Wayne A | $11,000 | |
| Closed | Ross Wayne A | $9,000 | |
| Closed | Ross Wayne A | $92,000 | |
| Closed | Ross Wayne A | $100,000 |
Source: Public Records
Tax History Compared to Growth
Tax History
| Year | Tax Paid | Tax Assessment Tax Assessment Total Assessment is a certain percentage of the fair market value that is determined by local assessors to be the total taxable value of land and additions on the property. | Land | Improvement |
|---|---|---|---|---|
| 2025 | $3,550 | $476,500 | $169,000 | $307,500 |
| 2024 | $3,486 | $451,000 | $150,000 | $301,000 |
| 2023 | $3,466 | $424,800 | $136,700 | $288,100 |
| 2022 | $3,035 | $381,500 | $136,700 | $244,800 |
| 2021 | $3,035 | $352,100 | $112,900 | $239,200 |
| 2020 | $5,324 | $347,600 | $108,400 | $239,200 |
| 2019 | $2,781 | $336,300 | $108,400 | $227,900 |
| 2018 | $2,583 | $316,200 | $109,600 | $206,600 |
| 2017 | $2,558 | $321,000 | $106,100 | $214,900 |
| 2016 | $2,441 | $308,600 | $102,600 | $206,000 |
| 2015 | $2,375 | $299,500 | $105,000 | $194,500 |
Source: Public Records
Map
Nearby Homes