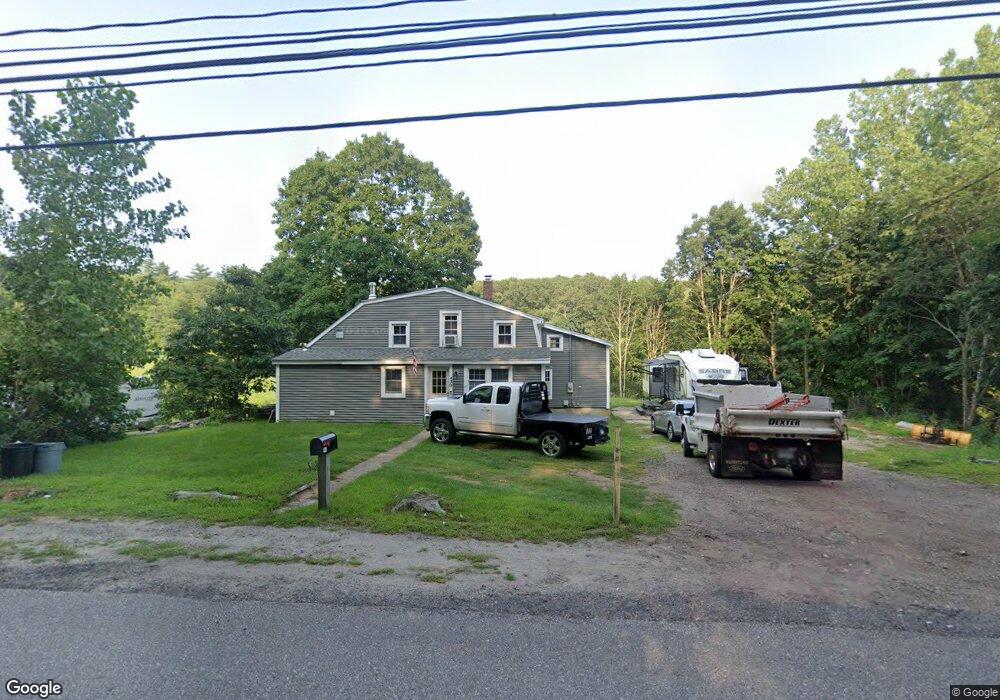
430 Green Hollow Rd Danielson, CT 06239
Estimated Value: $271,000 - $374,000
4
Beds
2
Baths
1,837
Sq Ft
$183/Sq Ft
Est. Value
About This Home
This home is located at 430 Green Hollow Rd, Danielson, CT 06239 and is currently estimated at $336,151, approximately $182 per square foot. 430 Green Hollow Rd is a home with nearby schools including Killingly Central School, Killingly Memorial School, and Killingly Intermediate School.
Ownership History
Date
Name
Owned For
Owner Type
Purchase Details
Closed on
Jul 19, 2023
Sold by
Chalet Series Iii T and Us Bank Tna
Bought by
Lemire Kyle and Bryan Justice
Current Estimated Value
Home Financials for this Owner
Home Financials are based on the most recent Mortgage that was taken out on this home.
Original Mortgage
$261,209
Outstanding Balance
$254,623
Interest Rate
6.71%
Mortgage Type
FHA
Estimated Equity
$81,528
Purchase Details
Closed on
Dec 2, 2022
Sold by
Johns Thomas H and Us Bank Na
Bought by
Us Bank Na
Purchase Details
Closed on
Jan 2, 2004
Sold by
Brooklyn Bldrs Llc
Bought by
Sizer John and Sizer Catherine
Purchase Details
Closed on
Nov 1, 1994
Sold by
Tetreault Ludiurine A
Bought by
Jones Thomas H and Jones Judith
Create a Home Valuation Report for This Property
The Home Valuation Report is an in-depth analysis detailing your home's value as well as a comparison with similar homes in the area
Home Values in the Area
Average Home Value in this Area
Purchase History
| Date | Buyer | Sale Price | Title Company |
|---|---|---|---|
| Lemire Kyle | $158,000 | None Available | |
| Lemire Kyle | $158,000 | None Available | |
| Us Bank Na | -- | None Available | |
| Us Bank Na | -- | None Available | |
| Sizer John | $315,000 | -- | |
| Sizer John | $315,000 | -- | |
| Jones Thomas H | $95,000 | -- | |
| Jones Thomas H | $95,000 | -- |
Source: Public Records
Mortgage History
| Date | Status | Borrower | Loan Amount |
|---|---|---|---|
| Open | Lemire Kyle | $261,209 | |
| Closed | Lemire Kyle | $261,209 | |
| Previous Owner | Jones Thomas H | $582,709 | |
| Previous Owner | Jones Thomas H | $170,000 |
Source: Public Records
Tax History Compared to Growth
Tax History
| Year | Tax Paid | Tax Assessment Tax Assessment Total Assessment is a certain percentage of the fair market value that is determined by local assessors to be the total taxable value of land and additions on the property. | Land | Improvement |
|---|---|---|---|---|
| 2025 | $4,120 | $172,660 | $38,080 | $134,580 |
| 2024 | $3,683 | $157,410 | $38,080 | $119,330 |
| 2023 | $3,589 | $157,500 | $38,080 | $119,420 |
| 2022 | $5,107 | $105,280 | $33,700 | $71,580 |
| 2021 | $3,225 | $105,280 | $33,700 | $71,580 |
| 2020 | $3,225 | $105,280 | $33,700 | $71,580 |
| 2019 | $3,225 | $105,280 | $33,700 | $71,580 |
| 2018 | $3,186 | $105,280 | $33,700 | $71,580 |
| 2017 | $3,140 | $97,440 | $26,220 | $71,220 |
| 2016 | $3,055 | $97,440 | $26,220 | $71,220 |
| 2015 | $2,988 | $97,440 | $26,220 | $71,220 |
| 2014 | $2,988 | $97,440 | $26,220 | $71,220 |
Source: Public Records
Map
Nearby Homes
- 436 Green Hollow Rd
- 431 Green Hollow Rd
- 425 Green Hollow Rd
- 411 Green Hollow Rd
- 439 Green Hollow Rd
- 414 Green Hollow Rd
- 446 Green Hollow Rd
- 445 Green Hollow Rd
- 391 Green Hollow Rd
- 397 Green Hollow Rd
- 432 Green Hollow Rd
- 451 Green Hollow Rd
- 394 Green Hollow Rd
- 456 Green Hollow Rd
- 458 Green Hollow Rd
- 461 Green Hollow Rd
- 379 Green Hollow Rd
- 376 Green Hollow Rd
- 32 Squaw Rock Rd
- 16 Squaw Rock Rd