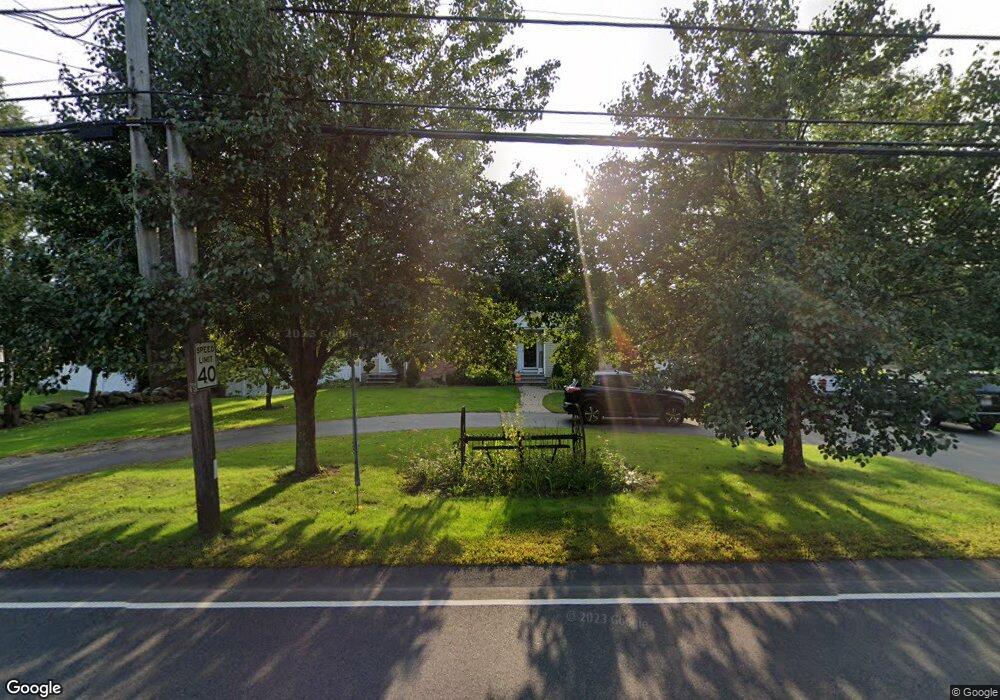
430 Hancock St Abington, MA 02351
Estimated Value: $519,000 - $787,000
4
Beds
2
Baths
1,926
Sq Ft
$350/Sq Ft
Est. Value
About This Home
This home is located at 430 Hancock St, Abington, MA 02351 and is currently estimated at $674,299, approximately $350 per square foot. 430 Hancock St is a home located in Plymouth County with nearby schools including Woodsdale School, Beaver Brook Elementary School, and Abington Middle School.
Ownership History
Date
Name
Owned For
Owner Type
Purchase Details
Closed on
Sep 11, 2012
Sold by
Parsons Stephen W
Bought by
Parsons Stephen W and Parsons Sherrie A
Current Estimated Value
Purchase Details
Closed on
Nov 24, 2003
Sold by
Parsons Genevieve A and Ferry Andrea
Bought by
Parsons Stephen W
Home Financials for this Owner
Home Financials are based on the most recent Mortgage that was taken out on this home.
Original Mortgage
$218,000
Interest Rate
5.98%
Mortgage Type
Purchase Money Mortgage
Create a Home Valuation Report for This Property
The Home Valuation Report is an in-depth analysis detailing your home's value as well as a comparison with similar homes in the area
Home Values in the Area
Average Home Value in this Area
Purchase History
| Date | Buyer | Sale Price | Title Company |
|---|---|---|---|
| Parsons Stephen W | -- | -- | |
| Parsons Stephen W | $278,000 | -- |
Source: Public Records
Mortgage History
| Date | Status | Borrower | Loan Amount |
|---|---|---|---|
| Previous Owner | Parsons Stephen W | $251,000 | |
| Previous Owner | Parsons Stephen W | $275,000 | |
| Previous Owner | Parsons Stephen W | $249,000 | |
| Previous Owner | Parsons Stephen W | $218,000 |
Source: Public Records
Tax History Compared to Growth
Tax History
| Year | Tax Paid | Tax Assessment Tax Assessment Total Assessment is a certain percentage of the fair market value that is determined by local assessors to be the total taxable value of land and additions on the property. | Land | Improvement |
|---|---|---|---|---|
| 2025 | $8,523 | $652,600 | $265,600 | $387,000 |
| 2024 | $8,606 | $643,200 | $243,900 | $399,300 |
| 2023 | $8,269 | $581,900 | $215,500 | $366,400 |
| 2022 | $8,216 | $539,800 | $191,900 | $347,900 |
| 2021 | $7,523 | $456,500 | $176,500 | $280,000 |
| 2020 | $7,628 | $448,700 | $171,900 | $276,800 |
| 2019 | $6,633 | $381,400 | $165,000 | $216,400 |
| 2018 | $3,691 | $371,900 | $165,000 | $206,900 |
| 2017 | $6,127 | $333,900 | $165,000 | $168,900 |
| 2016 | $5,696 | $317,700 | $158,400 | $159,300 |
| 2015 | $5,358 | $315,200 | $158,400 | $156,800 |
Source: Public Records
Map
Nearby Homes
- 332 Hancock St
- 89 Presidential Dr
- 451 Lincoln St
- 209 Hancock St
- 164 Hancock St
- 116 Hancock St
- 840 Hancock St
- 337 Randolph St
- 14 Kingswood Dr Unit 3
- 257 Rockland St Unit 257
- 676 Bedford St
- 0 Bedford St
- 1210 Washington St
- 333 Groveland St
- 1353 Washington St
- 14 Jamieson St
- 133 Andrew Ford Way
- 505 Hampton Way Unit 505
- 89 Andrew Ford Way
- 20 Cleverly St Unit B2
- 420 Hancock St
- 431 Hancock St
- 460 Hancock St
- 445 Hancock St
- 457 Hancock St
- 410 Hancock St
- 468 Hancock St
- 417 Hancock St
- 403 Hancock St
- 469 Hancock St
- 478 Hancock St
- 130 Loganberry Dr
- 400 Hancock St
- 393 Hancock St
- 477 Hancock St
- 36 Margaret Rd
- 33 Margaret Rd
- 18 Helen Dr
- 114 Loganberry Dr
- 488 Hancock St