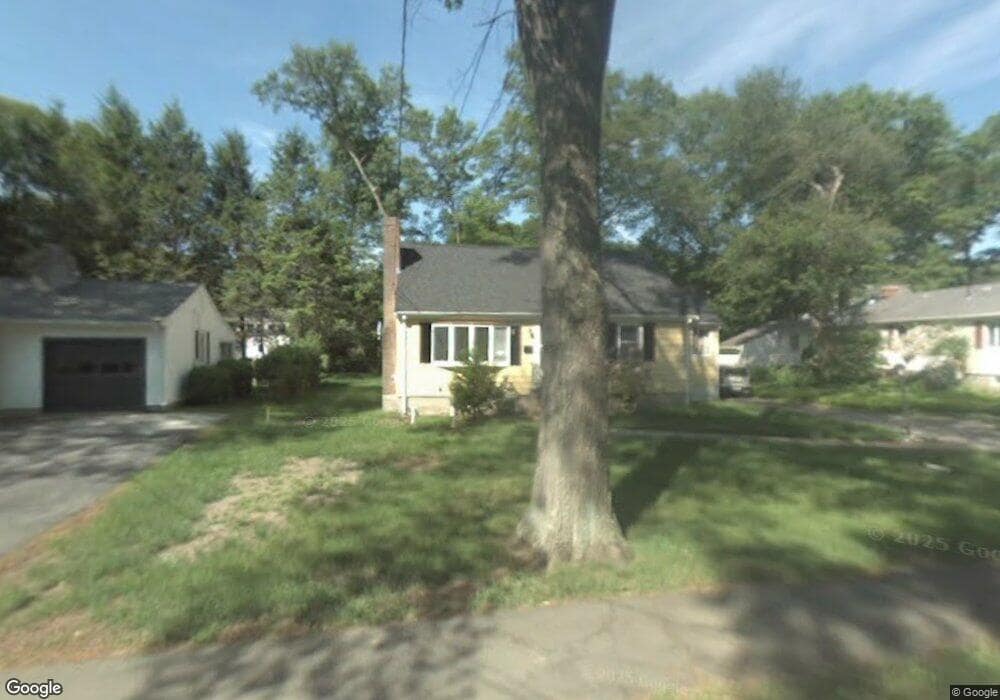
430 High Rock St Needham, MA 02492
Estimated Value: $1,152,000 - $1,266,709
3
Beds
2
Baths
1,116
Sq Ft
$1,100/Sq Ft
Est. Value
About This Home
This home is located at 430 High Rock St, Needham, MA 02492 and is currently estimated at $1,227,427, approximately $1,099 per square foot. 430 High Rock St is a home located in Norfolk County with nearby schools including Newman Elementary School, High Rock Middle School, and Pollard Middle School.
Ownership History
Date
Name
Owned For
Owner Type
Purchase Details
Closed on
Mar 11, 2004
Sold by
Follows Robert J
Bought by
Standard John K and Standard Seona M
Current Estimated Value
Home Financials for this Owner
Home Financials are based on the most recent Mortgage that was taken out on this home.
Original Mortgage
$333,700
Outstanding Balance
$153,564
Interest Rate
5.67%
Mortgage Type
Purchase Money Mortgage
Estimated Equity
$1,073,863
Create a Home Valuation Report for This Property
The Home Valuation Report is an in-depth analysis detailing your home's value as well as a comparison with similar homes in the area
Home Values in the Area
Average Home Value in this Area
Purchase History
| Date | Buyer | Sale Price | Title Company |
|---|---|---|---|
| Standard John K | $427,500 | -- | |
| Standard John K | $427,500 | -- |
Source: Public Records
Mortgage History
| Date | Status | Borrower | Loan Amount |
|---|---|---|---|
| Open | Standard John K | $333,700 | |
| Closed | Standard John K | $333,700 |
Source: Public Records
Tax History Compared to Growth
Tax History
| Year | Tax Paid | Tax Assessment Tax Assessment Total Assessment is a certain percentage of the fair market value that is determined by local assessors to be the total taxable value of land and additions on the property. | Land | Improvement |
|---|---|---|---|---|
| 2025 | $11,476 | $1,082,600 | $798,200 | $284,400 |
| 2024 | $9,414 | $751,900 | $505,300 | $246,600 |
| 2023 | $9,614 | $737,300 | $505,300 | $232,000 |
| 2022 | $9,221 | $689,700 | $463,700 | $226,000 |
| 2021 | $8,987 | $689,700 | $463,700 | $226,000 |
| 2020 | $8,622 | $690,300 | $463,700 | $226,600 |
| 2019 | $8,010 | $646,500 | $421,600 | $224,900 |
| 2018 | $7,680 | $646,500 | $421,600 | $224,900 |
| 2017 | $7,396 | $622,000 | $421,600 | $200,400 |
| 2016 | $6,824 | $591,300 | $421,600 | $169,700 |
| 2015 | $6,676 | $591,300 | $421,600 | $169,700 |
| 2014 | $6,205 | $533,100 | $366,700 | $166,400 |
Source: Public Records
Map
Nearby Homes
- 6 Frances St
- 424 High Rock St
- 74 Barrett St
- 80 Barrett St
- 18 Frances St
- 418 High Rock St
- 431 High Rock St
- 3 Frances St
- 86 Barrett St
- 24 Birchwood Rd
- 437 High Rock St
- 410 High Rock St
- 50 Barrett St
- 92 Barrett St
- 452 High Rock St
- 443 High Rock St
- 79 Barrett St
- 15 Birchwood Rd
- 30 Frances St
- 44 Barrett St