Estimated Value: $301,000 - $310,000
3
Beds
2
Baths
1,489
Sq Ft
$204/Sq Ft
Est. Value
About This Home
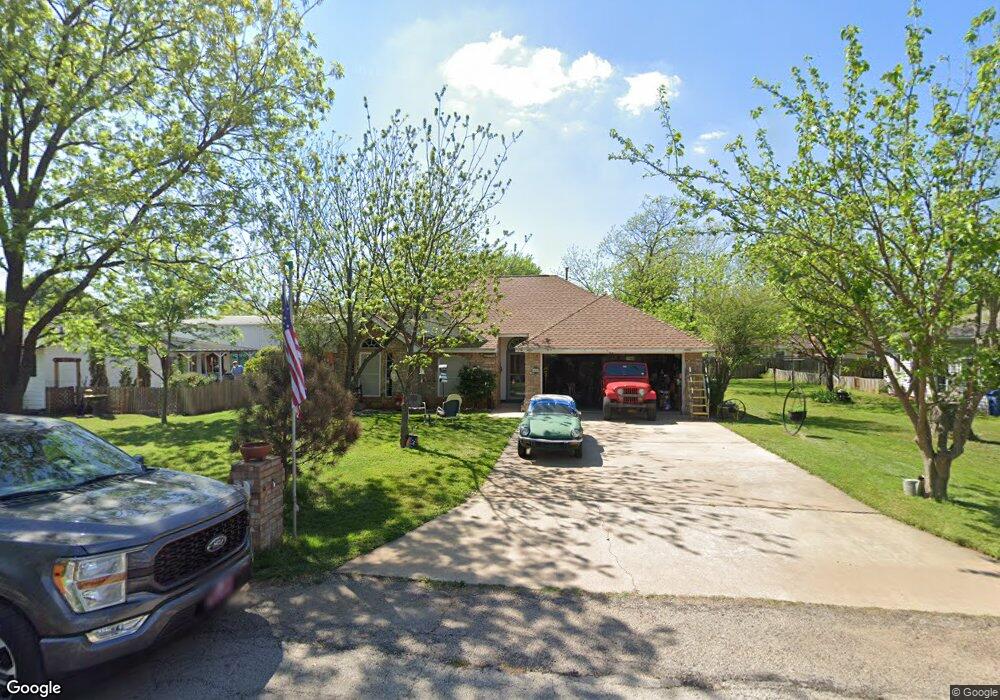
This home is located at 430 Jackson St, Krum, TX 76249 and is currently estimated at $303,522, approximately $203 per square foot. 430 Jackson St is a home located in Denton County with nearby schools including Krum Early Education Center, Dyer Elementary School, and Krum Middle School.
Ownership History
Date
Name
Owned For
Owner Type
Purchase Details
Closed on
May 30, 1997
Sold by
Kudlac Frank Matthew
Bought by
Martinez C A and Martinez Linda K
Current Estimated Value
Home Financials for this Owner
Home Financials are based on the most recent Mortgage that was taken out on this home.
Original Mortgage
$43,200
Interest Rate
8.1%
Purchase Details
Closed on
Oct 1, 1993
Sold by
Jerry Bagley Construction
Bought by
Martinez Carlos Antonio and Martinez Linda K
Home Financials for this Owner
Home Financials are based on the most recent Mortgage that was taken out on this home.
Original Mortgage
$73,954
Interest Rate
6.93%
Mortgage Type
FHA
Create a Home Valuation Report for This Property
The Home Valuation Report is an in-depth analysis detailing your home's value as well as a comparison with similar homes in the area
Home Values in the Area
Average Home Value in this Area
Purchase History
| Date | Buyer | Sale Price | Title Company |
|---|---|---|---|
| Martinez C A | -- | -- | |
| Martinez Carlos Antonio | -- | -- |
Source: Public Records
Mortgage History
| Date | Status | Borrower | Loan Amount |
|---|---|---|---|
| Closed | Martinez C A | $43,200 | |
| Previous Owner | Martinez Carlos Antonio | $73,954 |
Source: Public Records
Tax History Compared to Growth
Tax History
| Year | Tax Paid | Tax Assessment Tax Assessment Total Assessment is a certain percentage of the fair market value that is determined by local assessors to be the total taxable value of land and additions on the property. | Land | Improvement |
|---|---|---|---|---|
| 2025 | $2,383 | $301,882 | $61,600 | $260,806 |
| 2024 | $5,531 | $274,438 | $0 | $0 |
| 2023 | $2,237 | $249,489 | $61,600 | $247,683 |
| 2022 | $5,202 | $226,808 | $46,640 | $237,784 |
| 2021 | $4,572 | $206,189 | $36,960 | $169,229 |
| 2020 | $4,720 | $208,416 | $36,960 | $171,456 |
| 2019 | $4,967 | $205,841 | $36,960 | $168,881 |
| 2018 | $4,625 | $190,717 | $36,960 | $162,907 |
| 2017 | $4,223 | $173,379 | $28,160 | $167,750 |
| 2016 | $3,470 | $157,617 | $28,160 | $143,034 |
| 2015 | $2,973 | $143,288 | $28,160 | $115,781 |
| 2014 | $2,973 | $130,262 | $28,160 | $102,102 |
| 2013 | -- | $120,686 | $28,160 | $92,526 |
Source: Public Records
Map
Nearby Homes