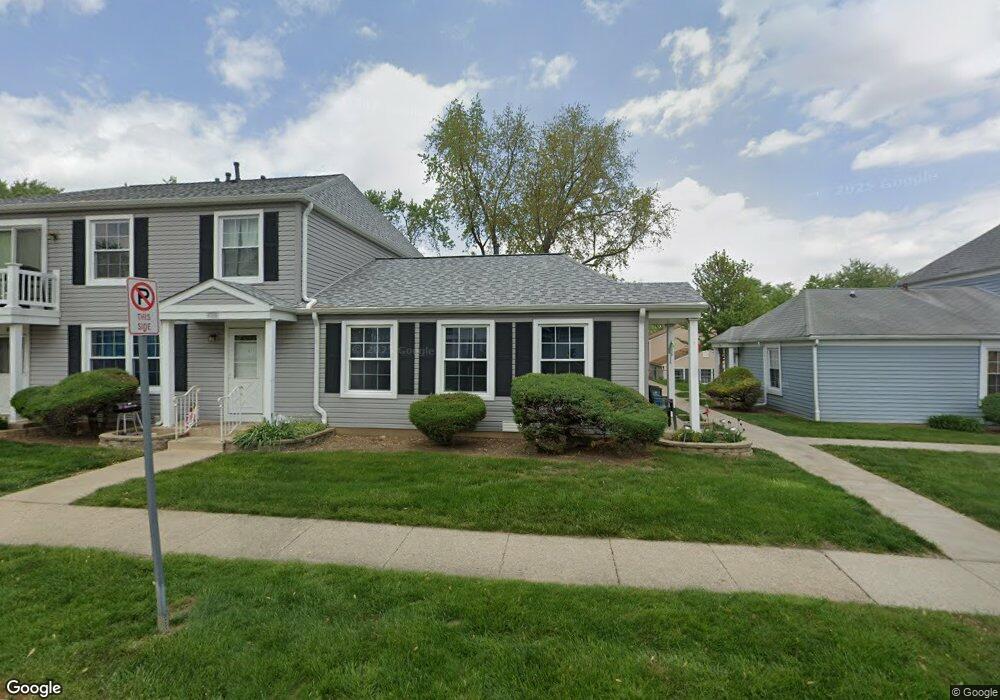
430 James Ct Unit 18D Glendale Heights, IL 60139
Estimated Value: $182,000 - $206,000
2
Beds
1
Bath
882
Sq Ft
$219/Sq Ft
Est. Value
About This Home
This home is located at 430 James Ct Unit 18D, Glendale Heights, IL 60139 and is currently estimated at $193,333, approximately $219 per square foot. 430 James Ct Unit 18D is a home located in DuPage County with nearby schools including South Loop Elementary School, Marquardt Middle School, and Glenbard East High School.
Ownership History
Date
Name
Owned For
Owner Type
Purchase Details
Closed on
Oct 6, 2017
Sold by
Nationstar Mortgage Llc
Bought by
Kawa Janusz and Kawa Maria
Current Estimated Value
Purchase Details
Closed on
Aug 8, 2017
Sold by
Quiroga Dora T and Quiroga Dora T
Bought by
Nationstar Mortgage Llc
Purchase Details
Closed on
Jul 14, 2011
Sold by
Quiroga Dora T
Bought by
Quiroga Dora T and The Dora T Quiroga Living Trust
Purchase Details
Closed on
Aug 23, 2004
Sold by
Willimann Lyle
Bought by
Quiroga Jose A and Quiroga Dora T
Home Financials for this Owner
Home Financials are based on the most recent Mortgage that was taken out on this home.
Original Mortgage
$97,000
Interest Rate
6.17%
Mortgage Type
Purchase Money Mortgage
Create a Home Valuation Report for This Property
The Home Valuation Report is an in-depth analysis detailing your home's value as well as a comparison with similar homes in the area
Home Values in the Area
Average Home Value in this Area
Purchase History
| Date | Buyer | Sale Price | Title Company |
|---|---|---|---|
| Kawa Janusz | $76,991 | Chicago Title | |
| Nationstar Mortgage Llc | -- | Attorney | |
| Quiroga Dora T | -- | None Available | |
| Quiroga Jose A | $123,500 | Atg |
Source: Public Records
Mortgage History
| Date | Status | Borrower | Loan Amount |
|---|---|---|---|
| Previous Owner | Quiroga Jose A | $97,000 |
Source: Public Records
Tax History Compared to Growth
Tax History
| Year | Tax Paid | Tax Assessment Tax Assessment Total Assessment is a certain percentage of the fair market value that is determined by local assessors to be the total taxable value of land and additions on the property. | Land | Improvement |
|---|---|---|---|---|
| 2024 | $2,705 | $44,790 | $12,171 | $32,619 |
| 2023 | $2,419 | $40,960 | $11,130 | $29,830 |
| 2022 | $2,251 | $32,840 | $10,340 | $22,500 |
| 2021 | $2,160 | $31,200 | $9,820 | $21,380 |
| 2020 | $2,017 | $30,440 | $9,580 | $20,860 |
| 2019 | $1,904 | $29,260 | $9,210 | $20,050 |
| 2018 | $1,203 | $21,440 | $8,970 | $12,470 |
| 2017 | $1,671 | $19,870 | $8,310 | $11,560 |
| 2016 | $1,556 | $18,390 | $7,690 | $10,700 |
| 2015 | $1,485 | $17,160 | $7,180 | $9,980 |
| 2014 | $2,497 | $24,690 | $7,180 | $17,510 |
| 2013 | $2,517 | $25,540 | $7,430 | $18,110 |
Source: Public Records
Map
Nearby Homes
- 1277 Prairie Ave Unit C
- 419 Sidney Ave Unit C
- 488 Darlene Ln Unit D
- 509 Darlene Ln Unit A
- 517 James Ct Unit A
- 2N238 Highland Ave
- 2N314 Euclid Ave
- 2N101 Glen Ellyn Rd
- 1N713 Evergreen Ave
- 1352 Glen Ellyn Rd
- 1160 Cedar St Unit 3A
- 23W285 Armitage Ave
- 1N450 Highland Ave
- 661 Easy St
- 2N061 Bloomingdale Rd
- 270 Shorewood Dr Unit GA
- 615 Nolan Ave
- 691 Burdette Ave
- 242 Shorewood Dr Unit 1B
- 426 Norton Ave
- 1268 Prairie Ave Unit A
- 424 James Ct Unit A
- 1276 Prairie Ave Unit D
- 1276 Prairie Ave Unit A
- 438 James Ct Unit C
- 1280 Prairie Ave Unit C
- 424 James Ct Unit C
- 1280 Prairie Ave Unit A
- 1280 Prairie Ave Unit D
- 1270 Prairie Ave Unit C
- 1272 Prairie Ave Unit D
- 424 James Ct Unit B
- 1276 Prairie Ave Unit C
- 1274 Prairie Ave Unit D
- 1274 Prairie Ave Unit A
- 1274 Prairie Ave Unit C
- 1276 Prairie Ave Unit B
- 438 James Ct Unit D
- 430 James Ct Unit A
- 438 James Ct Unit A