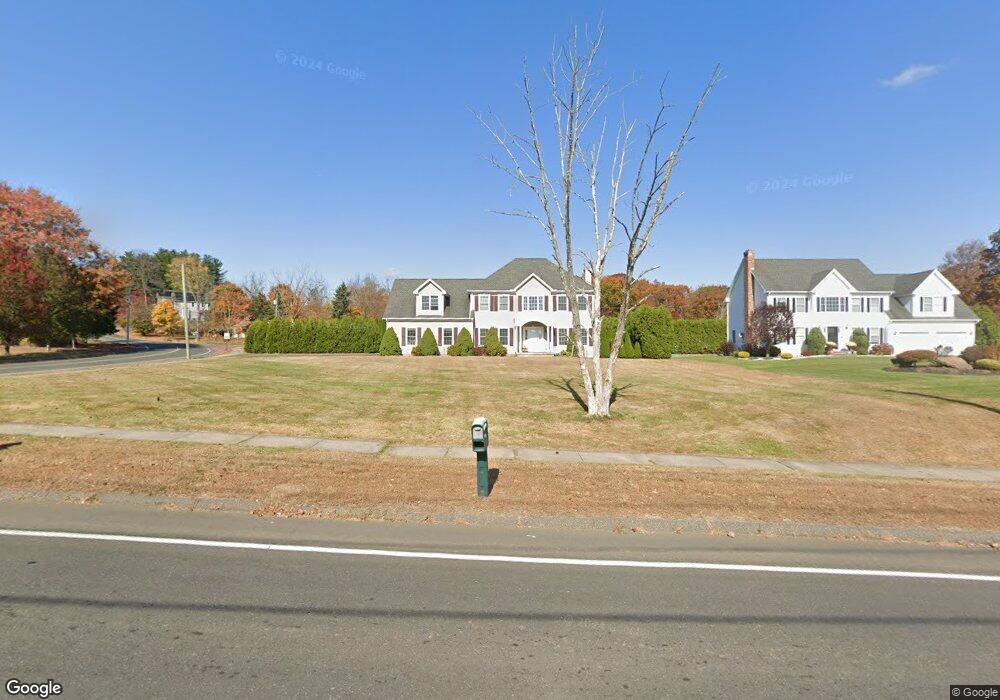
430 James P Casey Rd Bristol, CT 06010
North Bristol NeighborhoodEstimated Value: $609,000 - $670,000
4
Beds
3
Baths
2,892
Sq Ft
$220/Sq Ft
Est. Value
About This Home
This home is located at 430 James P Casey Rd, Bristol, CT 06010 and is currently estimated at $637,662, approximately $220 per square foot. 430 James P Casey Rd is a home located in Hartford County with nearby schools including West Bristol Sch, Bristol Central High School, and Immanuel Lutheran School.
Ownership History
Date
Name
Owned For
Owner Type
Purchase Details
Closed on
Feb 12, 2018
Sold by
Zhang Hanlin
Bought by
Lu Jie and Zhang Hanlin
Current Estimated Value
Purchase Details
Closed on
Jan 7, 2015
Sold by
Tema Agim
Bought by
Pnc Bank Na
Home Financials for this Owner
Home Financials are based on the most recent Mortgage that was taken out on this home.
Original Mortgage
$200,000
Interest Rate
3.99%
Mortgage Type
New Conventional
Purchase Details
Closed on
Apr 21, 2005
Sold by
Jabaj Ent Llc
Bought by
Tema Agim and Tema Fatbardha
Home Financials for this Owner
Home Financials are based on the most recent Mortgage that was taken out on this home.
Original Mortgage
$250,000
Interest Rate
5.87%
Purchase Details
Closed on
Aug 6, 2004
Sold by
Clinton Roberts Fndtn
Bought by
Jabaj Ent Llc
Create a Home Valuation Report for This Property
The Home Valuation Report is an in-depth analysis detailing your home's value as well as a comparison with similar homes in the area
Home Values in the Area
Average Home Value in this Area
Purchase History
| Date | Buyer | Sale Price | Title Company |
|---|---|---|---|
| Lu Jie | -- | -- | |
| Pnc Bank Na | -- | -- | |
| Tema Agim | $421,700 | -- | |
| Jabaj Ent Llc | $70,000 | -- |
Source: Public Records
Mortgage History
| Date | Status | Borrower | Loan Amount |
|---|---|---|---|
| Previous Owner | Jabaj Ent Llc | $200,000 | |
| Previous Owner | Jabaj Ent Llc | $324,000 | |
| Previous Owner | Jabaj Ent Llc | $140,000 | |
| Previous Owner | Jabaj Ent Llc | $250,000 |
Source: Public Records
Tax History Compared to Growth
Tax History
| Year | Tax Paid | Tax Assessment Tax Assessment Total Assessment is a certain percentage of the fair market value that is determined by local assessors to be the total taxable value of land and additions on the property. | Land | Improvement |
|---|---|---|---|---|
| 2025 | $11,401 | $337,820 | $61,600 | $276,220 |
| 2024 | $10,760 | $337,820 | $61,600 | $276,220 |
| 2023 | $8,390 | $276,430 | $61,600 | $214,830 |
| 2022 | $7,960 | $207,550 | $47,530 | $160,020 |
| 2021 | $7,960 | $207,550 | $47,530 | $160,020 |
| 2020 | $7,960 | $207,550 | $47,530 | $160,020 |
| 2019 | $7,897 | $207,550 | $47,530 | $160,020 |
| 2018 | $7,654 | $207,550 | $47,530 | $160,020 |
| 2017 | $7,314 | $203,000 | $67,900 | $135,100 |
| 2016 | $7,314 | $203,000 | $67,900 | $135,100 |
| 2015 | $7,026 | $203,000 | $67,900 | $135,100 |
| 2014 | $8,353 | $241,360 | $67,900 | $173,460 |
Source: Public Records
Map
Nearby Homes
- 439 James P Casey Rd
- 35 James P Casey Rd
- 90 Battle St
- 1970 Perkins St
- 62 (Lot 13-1) James P Casey Rd
- 146 Perkins St
- 6 Ridgecrest Ln
- 321 Matthews St
- 0 Hart St Unit 170255530
- 123 El Toro Dr
- 114 El Toro Dr
- 6 Sand Hill Rd
- 48 Boivin St
- 820 Matthews St Unit 29
- 6 El Toro Dr
- 39 Pine Meadow Dr
- 51 Pine Meadow Dr
- 276 Hart St
- 26 Martin Rd
- 565 Clark Ave Unit 17
- 416 James P Casey Rd
- 400 James P Casey Rd
- 415 James P Casey Rd
- 16 Battle St
- 375 W Washington St
- 70 Battle St
- 456 James P Casey Rd
- 50 Battle St
- 62 James P Casey Rd
- 13-1 James P Casey Rd
- 476 James P Casey Rd
- 30 Battle St
- 16-2 Battle St
- 491 James P Casey Rd
- 481 James P Casey Rd
- 16-1 Battle St
- 490 James P Casey Rd
- 111 Battle St
- 40 Battle St
- 541 Perkins St