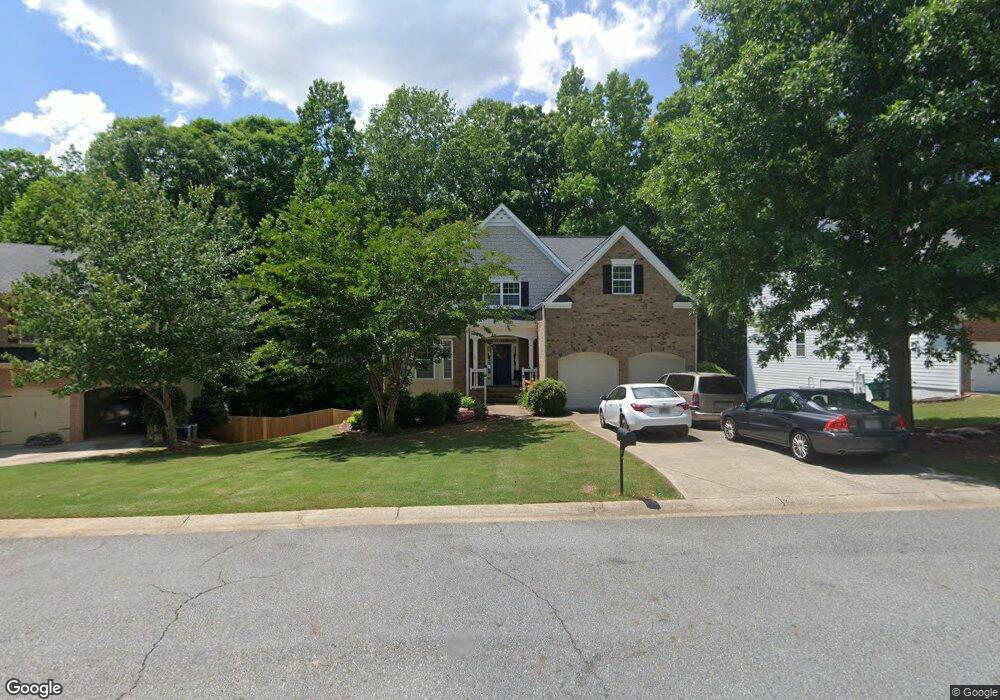
430 Juniper Ct Canton, GA 30115
Union Hill NeighborhoodEstimated Value: $467,000 - $478,420
4
Beds
3
Baths
2,542
Sq Ft
$186/Sq Ft
Est. Value
About This Home
This home is located at 430 Juniper Ct, Canton, GA 30115 and is currently estimated at $472,710, approximately $185 per square foot. 430 Juniper Ct is a home located in Cherokee County with nearby schools including Avery Elementary School, Creekland Middle School, and Creekview High School.
Ownership History
Date
Name
Owned For
Owner Type
Purchase Details
Closed on
Mar 15, 2018
Sold by
Goodwin Joshua Aaron
Bought by
Long James D
Current Estimated Value
Home Financials for this Owner
Home Financials are based on the most recent Mortgage that was taken out on this home.
Original Mortgage
$276,740
Outstanding Balance
$236,627
Interest Rate
4.38%
Mortgage Type
VA
Estimated Equity
$236,083
Purchase Details
Closed on
Jul 27, 2009
Sold by
Pedersen Roger J and Pedersen Holly K
Bought by
Goodwin Joshua A and Goodwin Jennifer K
Home Financials for this Owner
Home Financials are based on the most recent Mortgage that was taken out on this home.
Original Mortgage
$161,986
Interest Rate
5.37%
Mortgage Type
FHA
Purchase Details
Closed on
Sep 30, 2005
Sold by
D R Horton Inc
Bought by
Pedersen Roger J
Home Financials for this Owner
Home Financials are based on the most recent Mortgage that was taken out on this home.
Original Mortgage
$249,850
Interest Rate
6%
Mortgage Type
New Conventional
Create a Home Valuation Report for This Property
The Home Valuation Report is an in-depth analysis detailing your home's value as well as a comparison with similar homes in the area
Home Values in the Area
Average Home Value in this Area
Purchase History
| Date | Buyer | Sale Price | Title Company |
|---|---|---|---|
| Long James D | $267,900 | -- | |
| Goodwin Joshua A | $165,000 | -- | |
| Pedersen Roger J | $263,300 | -- |
Source: Public Records
Mortgage History
| Date | Status | Borrower | Loan Amount |
|---|---|---|---|
| Open | Long James D | $276,740 | |
| Previous Owner | Goodwin Joshua A | $161,986 | |
| Previous Owner | Pedersen Roger J | $249,850 |
Source: Public Records
Tax History
| Year | Tax Paid | Tax Assessment Tax Assessment Total Assessment is a certain percentage of the fair market value that is determined by local assessors to be the total taxable value of land and additions on the property. | Land | Improvement |
|---|---|---|---|---|
| 2025 | $1,539 | $192,720 | $35,200 | $157,520 |
| 2024 | $4,888 | $188,080 | $35,200 | $152,880 |
| 2023 | $5,195 | $199,920 | $33,200 | $166,720 |
| 2022 | $4,073 | $154,960 | $32,000 | $122,960 |
| 2021 | $3,391 | $119,440 | $20,800 | $98,640 |
| 2020 | $3,152 | $110,920 | $20,800 | $90,120 |
| 2019 | $3,061 | $107,720 | $20,800 | $86,920 |
| 2018 | $2,748 | $101,600 | $19,760 | $81,840 |
| 2017 | $2,712 | $247,100 | $18,400 | $80,440 |
| 2016 | $2,712 | $245,300 | $17,200 | $80,920 |
| 2015 | $2,348 | $205,400 | $17,200 | $64,960 |
| 2014 | $2,144 | $187,700 | $14,800 | $60,280 |
Source: Public Records
Map
Nearby Homes
- 422 Juniper Ct
- 605 Little Shoals Ct
- 109 Wood Duck Landing
- 8024 E Cherokee Dr
- 109 Wood Duck Lodge
- 7915 E Cherokee Dr
- 421 Pine Log Ct
- 204 Toonigh Way
- 259 Deer Valley Run
- 494 Johnson Brady Rd
- 301 Deer Valley Run
- 309 Deer Valley Run
- 211 Memory Ln
- 504 Stillbrook Ct
- 402 Greyfield Dr
- 213 Haley Farm Way
- 601 Davenport Place
- 105 Aspen Hall Dr
- 172 Aspen Hall Dr
- 140 Woodmont Ct
- 428 Juniper Ct
- 429 Juniper Ct
- 429 Juniper Ct Unit 114
- 426 Juniper Ct
- 419 Juniper Ct
- 417 Juniper Ct
- 427 Juniper Ct
- 421 Juniper Ct
- 424 Juniper Ct
- 425 Juniper Ct
- 423 Juniper Ct
- 420 Juniper Ct
- 418 Juniper Ct
- 415 Juniper Ct
- 156 Oak Haven Dr
- 158 Oak Haven Dr
- 511 Cottonwood Ct
- 168 Little Shoals Dr
- 154 Oak Haven Dr
- 160 Oak Haven Dr
Your Personal Tour Guide
Ask me questions while you tour the home.