Estimated Value: $1,093,608 - $1,177,000
5
Beds
4
Baths
2,730
Sq Ft
$416/Sq Ft
Est. Value
About This Home
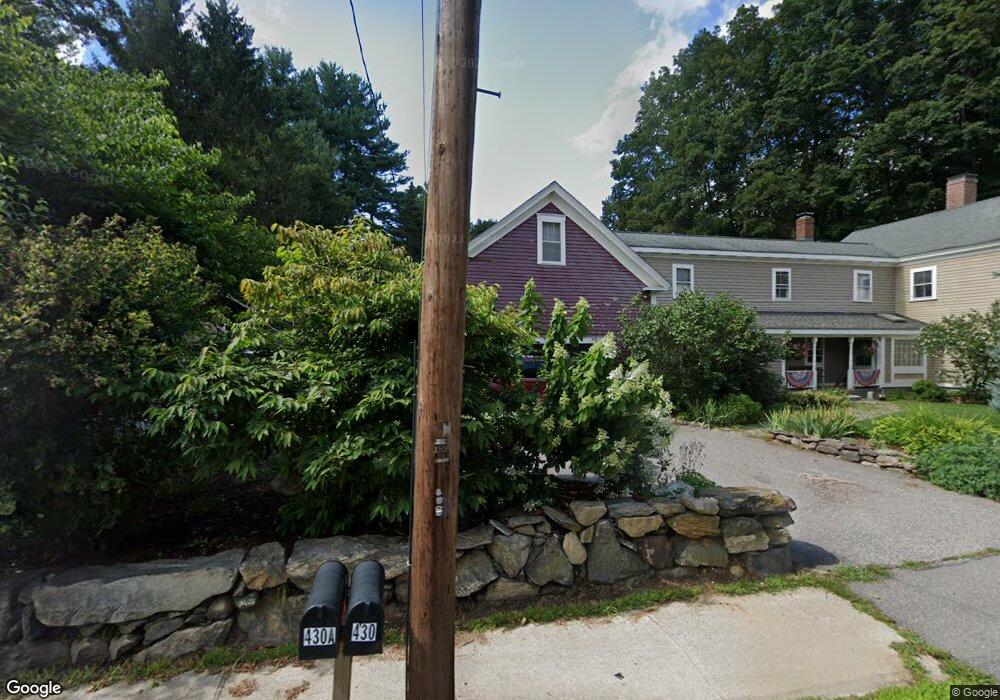
This home is located at 430 Main St, Acton, MA 01720 and is currently estimated at $1,134,902, approximately $415 per square foot. 430 Main St is a home located in Middlesex County with nearby schools including Acton-Boxborough Regional High School and Oak Meadow Montessori School.
Ownership History
Date
Name
Owned For
Owner Type
Purchase Details
Closed on
Nov 23, 2009
Sold by
Harrington Paul and Harrington Elizabeth A
Bought by
Kiernan Sarah Stuart and Kiernan Scott
Current Estimated Value
Home Financials for this Owner
Home Financials are based on the most recent Mortgage that was taken out on this home.
Original Mortgage
$506,460
Interest Rate
4.86%
Mortgage Type
Purchase Money Mortgage
Purchase Details
Closed on
Oct 16, 1998
Sold by
Marilyn H Abbott Ret and Abbott Marilyn H
Bought by
Harrington Paul and Harrington Elizabeth
Home Financials for this Owner
Home Financials are based on the most recent Mortgage that was taken out on this home.
Original Mortgage
$280,000
Interest Rate
6.8%
Mortgage Type
Purchase Money Mortgage
Create a Home Valuation Report for This Property
The Home Valuation Report is an in-depth analysis detailing your home's value as well as a comparison with similar homes in the area
Home Values in the Area
Average Home Value in this Area
Purchase History
| Date | Buyer | Sale Price | Title Company |
|---|---|---|---|
| Kiernan Sarah Stuart | $525,000 | -- | |
| Harrington Paul | $435,000 | -- |
Source: Public Records
Mortgage History
| Date | Status | Borrower | Loan Amount |
|---|---|---|---|
| Open | Harrington Paul | $508,244 | |
| Closed | Kiernan Sarah Stuart | $506,460 | |
| Previous Owner | Harrington Paul | $280,000 |
Source: Public Records
Tax History
| Year | Tax Paid | Tax Assessment Tax Assessment Total Assessment is a certain percentage of the fair market value that is determined by local assessors to be the total taxable value of land and additions on the property. | Land | Improvement |
|---|---|---|---|---|
| 2025 | $14,490 | $844,900 | $332,400 | $512,500 |
| 2024 | $14,084 | $844,900 | $332,400 | $512,500 |
| 2023 | $13,955 | $794,700 | $302,500 | $492,200 |
| 2022 | $13,457 | $691,900 | $263,000 | $428,900 |
| 2021 | $13,012 | $643,200 | $243,400 | $399,800 |
| 2020 | $12,529 | $651,200 | $243,400 | $407,800 |
| 2019 | $12,002 | $619,600 | $243,400 | $376,200 |
| 2018 | $11,849 | $611,400 | $243,400 | $368,000 |
| 2017 | $11,392 | $597,700 | $243,400 | $354,300 |
| 2016 | $11,388 | $592,200 | $243,400 | $348,800 |
| 2015 | $11,177 | $586,700 | $243,400 | $343,300 |
| 2014 | $10,878 | $559,300 | $243,400 | $315,900 |
Source: Public Records
Map
Nearby Homes
- 11 Braebrook
- 491 Main St
- 46 Taylor Rd
- 33 Meadowbrook Rd
- 18 Hayward Rd
- 27 Forest Rd
- 709 Main St
- 524 Main St
- 95 Concord Rd
- 79 Charter Rd
- 246 Main St Unit 2
- 7 Kelley Rd
- 20 Joseph Reed Ln
- 15 Davis Rd Unit B-8
- 5 Perkins Ln
- 1 Bayberry Rd
- 11 Davis Rd Unit A5
- 11 Davis Rd Unit B8
- 303 School St
- 7 Hillcrest Dr
- 427 Main St
- 21 John Swift Rd
- 0000 Confidential
- 1111 Not Disclosed
- 392A Great Rd Condos Unit 203
- 384B Great Rd Condos Unit B303
- 42-1 Davis Rd- Heat Included
- Lot 3A Centennial Ln
- 3 Bullette Rd
- 438 Main St
- 439 Main St Unit 439
- 439 Main St Unit 1
- 439 Main St Unit 2
- 437 Main St
- 437 Main St Unit 1
- 19 John Swift Rd
- 434 Main St
- 3 Taylor Rd
- 446 Main St
- 22 John Swift Rd
Your Personal Tour Guide
Ask me questions while you tour the home.