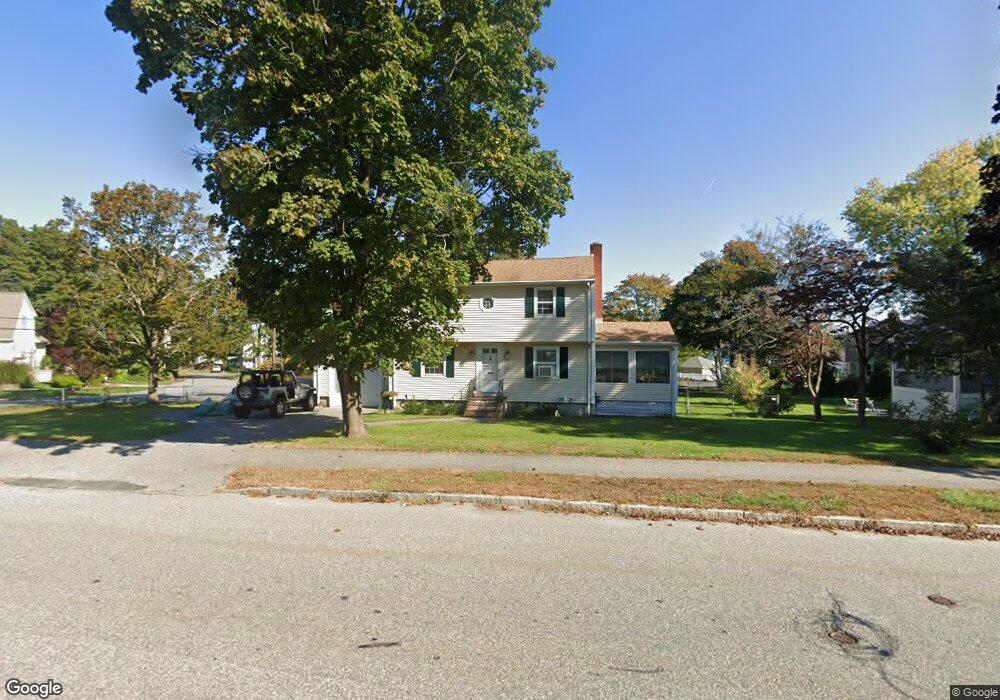
430 Main St North Andover, MA 01845
Estimated Value: $717,478 - $849,000
4
Beds
2
Baths
2,190
Sq Ft
$364/Sq Ft
Est. Value
About This Home
This home is located at 430 Main St, North Andover, MA 01845 and is currently estimated at $797,870, approximately $364 per square foot. 430 Main St is a home located in Essex County with nearby schools including Atkinson Elementary School, North Andover Middle School, and North Andover High School.
Ownership History
Date
Name
Owned For
Owner Type
Purchase Details
Closed on
Nov 5, 2021
Sold by
Levitt Susan
Bought by
Larsen Amy
Current Estimated Value
Purchase Details
Closed on
Mar 16, 2020
Sold by
Levitt Susan C
Bought by
Levitt Susan C and Levitt Katie A
Purchase Details
Closed on
Jan 29, 2020
Sold by
Middleton Allen W
Bought by
Levitt Susan C
Purchase Details
Closed on
Dec 11, 1987
Sold by
Middleton Helen
Bought by
Middleton Allen W
Home Financials for this Owner
Home Financials are based on the most recent Mortgage that was taken out on this home.
Original Mortgage
$70,000
Interest Rate
10.96%
Mortgage Type
Purchase Money Mortgage
Create a Home Valuation Report for This Property
The Home Valuation Report is an in-depth analysis detailing your home's value as well as a comparison with similar homes in the area
Home Values in the Area
Average Home Value in this Area
Purchase History
| Date | Buyer | Sale Price | Title Company |
|---|---|---|---|
| Larsen Amy | -- | None Available | |
| Levitt Susan C | -- | None Available | |
| Levitt Susan C | -- | None Available | |
| Middleton Allen W | $185,000 | -- |
Source: Public Records
Mortgage History
| Date | Status | Borrower | Loan Amount |
|---|---|---|---|
| Previous Owner | Middleton Allen W | $70,000 |
Source: Public Records
Tax History Compared to Growth
Tax History
| Year | Tax Paid | Tax Assessment Tax Assessment Total Assessment is a certain percentage of the fair market value that is determined by local assessors to be the total taxable value of land and additions on the property. | Land | Improvement |
|---|---|---|---|---|
| 2025 | $6,696 | $594,700 | $341,200 | $253,500 |
| 2024 | $6,319 | $569,800 | $323,300 | $246,500 |
| 2023 | $5,936 | $485,000 | $273,000 | $212,000 |
| 2022 | $5,829 | $430,800 | $247,800 | $183,000 |
| 2021 | $5,577 | $393,600 | $224,500 | $169,100 |
| 2020 | $5,408 | $393,600 | $224,500 | $169,100 |
| 2019 | $5,278 | $393,600 | $224,500 | $169,100 |
| 2018 | $5,719 | $393,600 | $224,500 | $169,100 |
| 2017 | $4,954 | $346,900 | $185,800 | $161,100 |
| 2016 | $4,738 | $332,000 | $184,700 | $147,300 |
| 2015 | $4,752 | $330,200 | $178,200 | $152,000 |
Source: Public Records
Map
Nearby Homes
- 11 W Bradstreet Rd
- 168 Greene St
- 16 Court St
- 387 Massachusetts Ave
- 19 Fernview Ave Unit 6
- 19 Fernview Ave Unit 5
- 98 Mill Pond
- 12 Walker Rd Unit 6
- 8 Little Rd
- 35 Fernview Ave Unit 5
- 25 Fernview Ave Unit 8
- 23 Fernview Ave Unit 1
- 33 Herrick Rd
- 90 Edgelawn Ave Unit 1
- 52 Fernview Ave Unit 7
- 112 Mill Pond
- 64 2nd St
- 40 Fernview Ave Unit 11
- 115 Mill Pond
- 116 Mill Pond