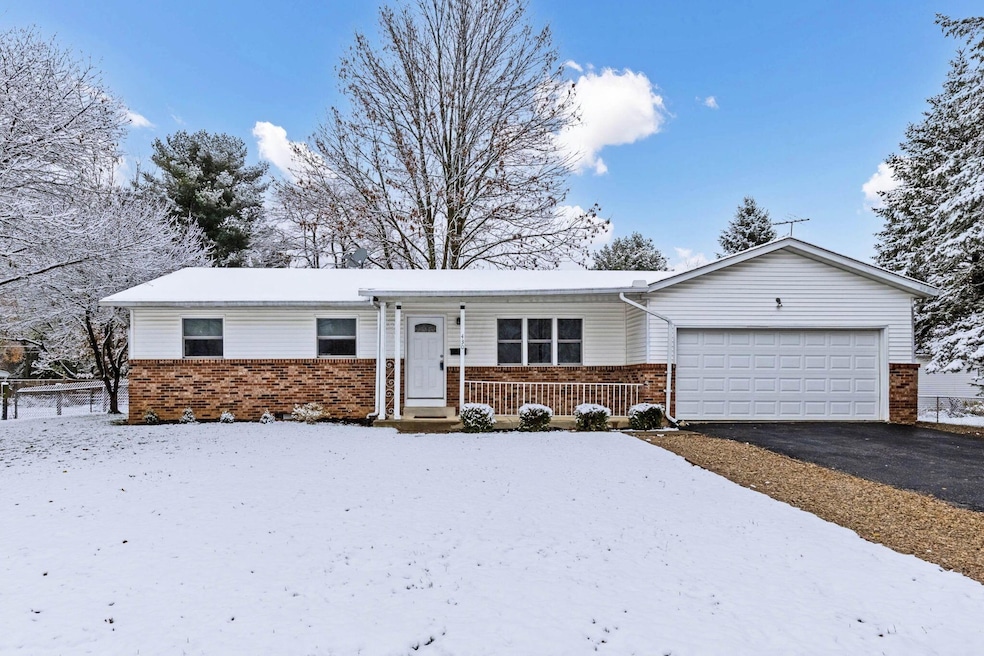
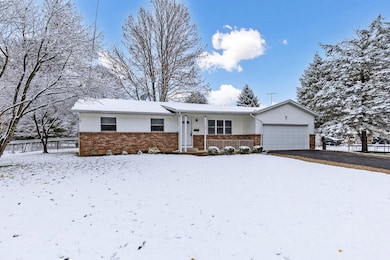
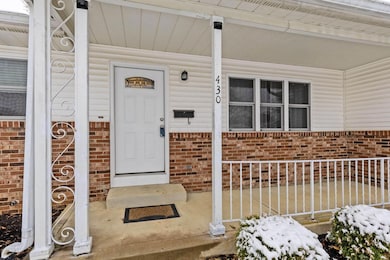
430 Maple St Groveport, OH 43125
Estimated payment $1,870/month
Highlights
- Hot Property
- Ranch Style House
- No HOA
- Deck
- Wood Flooring
- Fenced Yard
About This Home
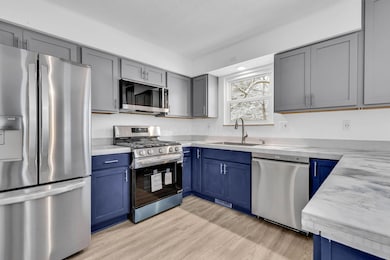
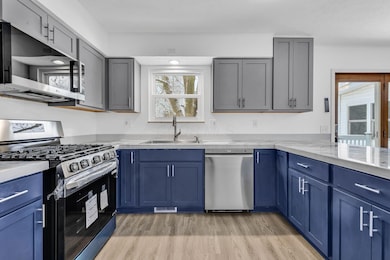
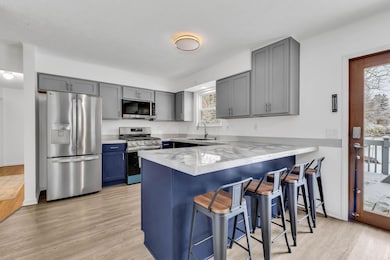
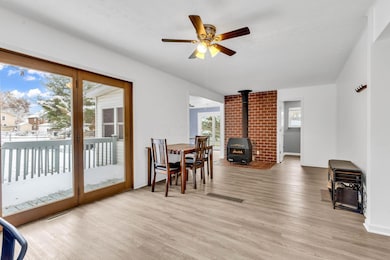
This move-in ready ranch in the heart of downtown Groveport blends thoughtful updates with timeless charm, set on a spacious 0.44-acre lot just a short walk from local shops, restaurants, and parks. Inside, the home offers a bright, open layout connecting the living, dining, and kitchen areas for seamless everyday living. The kitchen has been fully updated with brand-new stainless steel appliances, brand-new epoxy countertops, and stylish two-tone cabinetry. A classic wood stove sits between the dining and living areas, offering a subtle rustic touch to the main living space. With 3 bedrooms and 2 full bathrooms, the home has seen extensive improvements over the past few years, including refinished hardwood floors, new windows, updated lighting, interior and exterior doors, closet doors, baseboards, and refreshed bathrooms. The entire interior has also been repainted in recent years, giving the home a clean and cohesive finish. The roof was estimated to be only a couple years old at the time of purchase in 2021, offering added peace of mind. The basement includes two unfinished rooms currently used as a home gym and storage area, with potential to fully finish if desired. Outdoors, enjoy a refinished deck, newly planted garden beds, a fully fenced backyard, and mature trees that create an ideal space to relax or entertain. A 2-car garage adds extra convenience. This completely updated home offers move-in ready comfort, a spacious yard, and a walkable location all in one.
Open House Schedule
-
Sunday, November 16, 20251:00 to 3:00 pm11/16/2025 1:00:00 PM +00:0011/16/2025 3:00:00 PM +00:00Add to Calendar
Home Details
Home Type
- Single Family
Est. Annual Taxes
- $4,115
Year Built
- Built in 1972
Lot Details
- 0.44 Acre Lot
- Fenced Yard
Parking
- 2 Car Attached Garage
- Garage Door Opener
Home Design
- Ranch Style House
- Brick Exterior Construction
- Block Foundation
- Vinyl Siding
Interior Spaces
- 1,544 Sq Ft Home
- Family Room
Kitchen
- Gas Range
- Microwave
- Dishwasher
Flooring
- Wood
- Stone
- Vinyl
Bedrooms and Bathrooms
- 3 Main Level Bedrooms
- 2 Full Bathrooms
Laundry
- Laundry on lower level
- Electric Dryer Hookup
Basement
- Partial Basement
- Recreation or Family Area in Basement
- Crawl Space
Outdoor Features
- Deck
Utilities
- Forced Air Heating and Cooling System
- Heating System Uses Gas
- Gas Water Heater
Community Details
- No Home Owners Association
Listing and Financial Details
- Home warranty included in the sale of the property
- Assessor Parcel Number 185-000256
Map
Home Values in the Area
Average Home Value in this Area
Tax History
| Year | Tax Paid | Tax Assessment Tax Assessment Total Assessment is a certain percentage of the fair market value that is determined by local assessors to be the total taxable value of land and additions on the property. | Land | Improvement |
|---|---|---|---|---|
| 2024 | $4,115 | $84,150 | $29,930 | $54,220 |
| 2023 | $4,104 | $84,140 | $29,925 | $54,215 |
| 2022 | $3,380 | $55,620 | $15,860 | $39,760 |
| 2021 | $2,853 | $55,620 | $15,860 | $39,760 |
| 2020 | $2,861 | $55,620 | $15,860 | $39,760 |
| 2019 | $2,583 | $46,000 | $13,200 | $32,800 |
| 2018 | $1,299 | $46,000 | $13,200 | $32,800 |
| 2017 | $2,589 | $46,000 | $13,200 | $32,800 |
| 2016 | $2,576 | $42,220 | $12,080 | $30,140 |
| 2015 | $1,299 | $42,220 | $12,080 | $30,140 |
| 2014 | $2,446 | $42,220 | $12,080 | $30,140 |
| 2013 | $1,111 | $44,415 | $12,705 | $31,710 |
Property History
| Date | Event | Price | List to Sale | Price per Sq Ft |
|---|---|---|---|---|
| 11/13/2025 11/13/25 | For Sale | $289,900 | -- | $188 / Sq Ft |
Purchase History
| Date | Type | Sale Price | Title Company |
|---|---|---|---|
| Warranty Deed | $70,000 | Northwest Select Agency | |
| Warranty Deed | $210,000 | Northwest Select Ttl Agcy Ll | |
| Deed | -- | -- |
Mortgage History
| Date | Status | Loan Amount | Loan Type |
|---|---|---|---|
| Open | $189,000 | New Conventional | |
| Previous Owner | $189,000 | New Conventional |
Source: Columbus and Central Ohio Regional MLS
MLS Number: 225042672
APN: 185-000256
Disclaimer: Certain information contained herein is derived from information provided by parties other than Homes.com. All information provided is deemed reliable, but is not guaranteed to be accurate and should be independently verified.
![]() IDX information is provided exclusively for personal, non-commercial use, and may not be used for any purpose other than to identify prospective properties consumers may be interested in purchasing.
IDX information is provided exclusively for personal, non-commercial use, and may not be used for any purpose other than to identify prospective properties consumers may be interested in purchasing.
Information is deemed reliable but not guaranteed.
- 218-222 Center St
- 199 Mohr Ave
- 287 College St
- 135 Front St
- 213 Front St
- 303 Madison St
- 340 Madison St
- 250 Green Ave
- 4822 Elmont Place
- 7474 Groveport Rd
- 5777 Ebright Rd
- 5652 Red Alder St
- 5611 Shellbark St
- 5605 Red Alder St
- 5634 Shagbark Place
- 3450 Rohr Rd
- 5310 Sims Rd
- 3515 Rohr Rd
- 5156 Sand Ct
- 3463 Rohr Rd
- 389 West St
- 5056 Sunflower Dr
- 5734 Cedar Lawn Dr
- 5086 Sand Ct
- 3306 Lauren Fields Dr S
- 5300 Folsom Dr
- 5289 Earhart Dr
- 5151 Ebright Rd
- 4005 Vermilion Ave
- 4261 Hamilton Square Blvd
- 4100 Lakeview Crossing
- 4111 Wincove Dr
- 3939 Eastrise Dr
- 4133 Parkviewlake Dr
- 3995 S Hamilton Rd
- 2800 Booty Dr
- 4088 Plateau St
- 3844 Eastrise Dr
- 4464 Professional Pkwy
- 4365 Bayshire Rd
