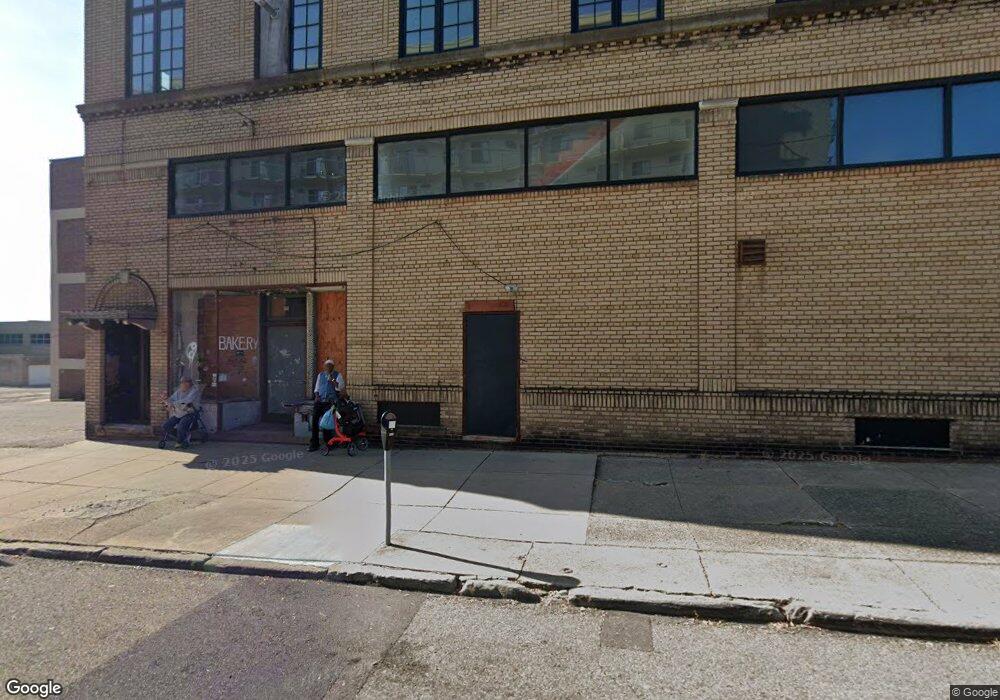
430 Market Ave N Canton, OH 44702
Downtown Canton NeighborhoodEstimated Value: $214,879
--
Bed
4
Baths
12,400
Sq Ft
$17/Sq Ft
Est. Value
About This Home
This home is located at 430 Market Ave N, Canton, OH 44702 and is currently estimated at $214,879, approximately $17 per square foot. 430 Market Ave N is a home located in Stark County with nearby schools including Early Learning Center @ Schreiber, Gibbs Elementary School, and Youtz Intermediate School.
Ownership History
Date
Name
Owned For
Owner Type
Purchase Details
Closed on
Dec 19, 2022
Sold by
Dclb Corp
Bought by
Ahkp Properties Llc
Current Estimated Value
Purchase Details
Closed on
Jan 12, 2017
Sold by
Market Canton Llc
Bought by
Dclb Corp
Purchase Details
Closed on
Dec 28, 2015
Sold by
Osv Holdings Inc
Bought by
Market Canton Llc
Purchase Details
Closed on
Oct 11, 2011
Sold by
F L L P Properties Llc
Bought by
Osv Holdings Inc
Purchase Details
Closed on
Mar 14, 2007
Sold by
Aman George J and Aman Mary K
Bought by
Flip Properties Llc
Home Financials for this Owner
Home Financials are based on the most recent Mortgage that was taken out on this home.
Original Mortgage
$236,453
Interest Rate
6.4%
Mortgage Type
Commercial
Create a Home Valuation Report for This Property
The Home Valuation Report is an in-depth analysis detailing your home's value as well as a comparison with similar homes in the area
Home Values in the Area
Average Home Value in this Area
Purchase History
| Date | Buyer | Sale Price | Title Company |
|---|---|---|---|
| Ahkp Properties Llc | -- | None Listed On Document | |
| Dclb Corp | $275,000 | American Title | |
| Market Canton Llc | $140,000 | First American | |
| Osv Holdings Inc | $193,000 | Attorney | |
| Flip Properties Llc | $290,000 | Attorney |
Source: Public Records
Mortgage History
| Date | Status | Borrower | Loan Amount |
|---|---|---|---|
| Previous Owner | Flip Properties Llc | $236,453 |
Source: Public Records
Tax History Compared to Growth
Tax History
| Year | Tax Paid | Tax Assessment Tax Assessment Total Assessment is a certain percentage of the fair market value that is determined by local assessors to be the total taxable value of land and additions on the property. | Land | Improvement |
|---|---|---|---|---|
| 2025 | -- | $73,960 | $8,750 | $65,210 |
| 2024 | -- | $73,960 | $8,750 | $65,210 |
| 2023 | $4,355 | $52,540 | $23,660 | $28,880 |
| 2022 | $4,434 | $54,780 | $23,700 | $31,080 |
| 2021 | $4,616 | $54,780 | $23,700 | $31,080 |
| 2020 | $3,720 | $49,780 | $21,530 | $28,250 |
| 2019 | $4,691 | $49,780 | $21,530 | $28,250 |
| 2018 | $4,121 | $49,780 | $21,530 | $28,250 |
| 2017 | $3,637 | $36,970 | $13,060 | $23,910 |
| 2016 | $3,661 | $36,970 | $13,060 | $23,910 |
| 2015 | $3,740 | $37,740 | $13,060 | $24,680 |
| 2014 | $382 | $35,210 | $12,180 | $23,030 |
| 2013 | $2,156 | $35,210 | $12,180 | $23,030 |
Source: Public Records
Map
Nearby Homes
- 722 High Ave NW
- 916 6th St NW
- 905 High Ave NW
- 806 Troy Place NW
- 1005 Dewalt Ave NW
- 1120 6th St NE
- 1007 Dewalt Ave NW
- 1015 4th St NW
- 1024 3rd St NW
- 413 Newton Ave NW
- 0 3rd St SE Unit 5132035
- 1226 Logan Ave NW
- 1224 Cleveland Ave NW
- 1227 Worley Ave NW
- 1231 Worley Ave NW
- 1427 4th St NE
- 1328 Logan Ave NW
- 1221 9th St NW
- 1511 2nd St NE
- 1332 Spring Ave NE
- 439 Market Ave N
- 415 Market Ave N
- 401 4th St NW
- 575 Market Ave N
- 529 Market Ave N
- 137 6th St NE
- 238 6th St NE
- 306 Market Ave N
- 306 Market Ave N
- 610 Market Ave N
- 227 3rd St NE
- 136 3rd St NE
- 328 Walnut Ave NE
- 200 3rd St NE
- 321 Court Ave NW
- 205 6th St NW
- 228 Market N
- 200 Market Ave N
- 624 Market Ave N
- 309 Court Ave NW