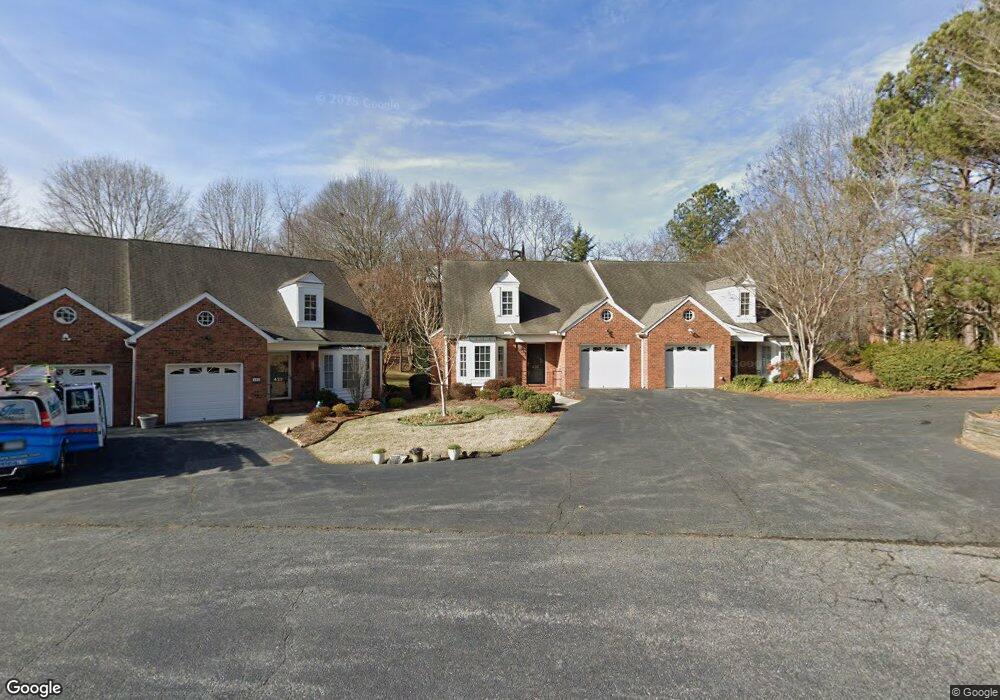
430 Marshall View Ct Winston Salem, NC 27101
South Marshall NeighborhoodEstimated Value: $442,005 - $456,000
3
Beds
3
Baths
2,167
Sq Ft
$207/Sq Ft
Est. Value
About This Home
This home is located at 430 Marshall View Ct, Winston Salem, NC 27101 and is currently estimated at $449,501, approximately $207 per square foot. 430 Marshall View Ct is a home located in Forsyth County with nearby schools including Diggs-Latham Elementary School, Flat Rock Middle, and Reynolds High School.
Ownership History
Date
Name
Owned For
Owner Type
Purchase Details
Closed on
Aug 30, 2021
Sold by
Wortman Danna Leslie and Lemmerman Danna Wortman
Bought by
Hall Katherine Elizabeth
Current Estimated Value
Home Financials for this Owner
Home Financials are based on the most recent Mortgage that was taken out on this home.
Original Mortgage
$275,000
Outstanding Balance
$250,230
Interest Rate
2.8%
Mortgage Type
New Conventional
Estimated Equity
$199,271
Purchase Details
Closed on
Jun 25, 2009
Sold by
Mecimore Charles D and Mecimore Barbara C
Bought by
Lemmerman Danna Wortman
Home Financials for this Owner
Home Financials are based on the most recent Mortgage that was taken out on this home.
Original Mortgage
$212,415
Interest Rate
4.79%
Mortgage Type
Purchase Money Mortgage
Purchase Details
Closed on
Dec 28, 2001
Sold by
Park Tanners
Bought by
Mecimore Charles D and Mecimore Barbara C
Create a Home Valuation Report for This Property
The Home Valuation Report is an in-depth analysis detailing your home's value as well as a comparison with similar homes in the area
Home Values in the Area
Average Home Value in this Area
Purchase History
| Date | Buyer | Sale Price | Title Company |
|---|---|---|---|
| Hall Katherine Elizabeth | $320,000 | Chicago Title Insurance Co | |
| Lemmerman Danna Wortman | $250,000 | None Available | |
| Mecimore Charles D | $190,000 | -- |
Source: Public Records
Mortgage History
| Date | Status | Borrower | Loan Amount |
|---|---|---|---|
| Open | Hall Katherine Elizabeth | $275,000 | |
| Previous Owner | Lemmerman Danna Wortman | $212,415 |
Source: Public Records
Tax History Compared to Growth
Tax History
| Year | Tax Paid | Tax Assessment Tax Assessment Total Assessment is a certain percentage of the fair market value that is determined by local assessors to be the total taxable value of land and additions on the property. | Land | Improvement |
|---|---|---|---|---|
| 2024 | $4,316 | $322,400 | $69,000 | $253,400 |
| 2023 | $4,316 | $322,400 | $69,000 | $253,400 |
| 2022 | $4,236 | $322,400 | $69,000 | $253,400 |
| 2021 | $4,160 | $322,400 | $69,000 | $253,400 |
| 2020 | $3,535 | $256,000 | $48,300 | $207,700 |
| 2019 | $3,561 | $256,000 | $48,300 | $207,700 |
| 2018 | $3,382 | $256,000 | $48,300 | $207,700 |
| 2016 | $3,282 | $249,384 | $48,300 | $201,084 |
| 2015 | $3,232 | $249,384 | $48,300 | $201,084 |
| 2014 | $3,134 | $249,384 | $48,300 | $201,084 |
Source: Public Records
Map
Nearby Homes
- 200 Tanners Mill Ct Unit 10
- 450 Front St Unit 13
- 411 S Marshall St Unit 206
- 621 Mulberry St
- 621 Mulberry St SW
- 509 S Green St
- 927 Apple St
- 1004 Albert St
- 825 S Poplar St
- 1024 Franklin St
- 410 Beaumont St
- 925 Walnut St SW
- 1086 W Bank St
- 821 Holland St SW
- 429 Gregory St
- 315 N Spruce St Unit 410
- 315 N Spruce St Unit 307
- 315 N Spruce St Unit 106
- 1 Park Vista Ln Unit 520
- 1 Park Vista Ln Unit 620
- 420 Marshall View Ct Unit 2F
- 410 Marshall View Ct
- 221 Tar Branch Ct Unit 222
- 220 Tar Branch Ct Unit 220
- 218 Tar Branch Ct Unit 218
- 223 Tar Branch Ct Unit 223
- 219 Tar Branch Ct Unit 219
- 425 Marshall View Ct Unit D2
- 415 Marshall View Ct Unit E1
- 212 Tar Branch Ct Unit 212
- 435 Marshall View Ct Unit D1
- 405 Marshall View Ct
- 211 Tar Branch Ct Unit 211
- 214 Tar Branch Ct Unit 214
- 217 Tar Branch Ct
- 215 Tar Branch Ct Unit 215
- 210 Tar Branch Ct Unit 210
- 445 Marshall View Ct
- 455 Marshall View Ct Unit C1
- 465 Marshall View Ct Unit B2