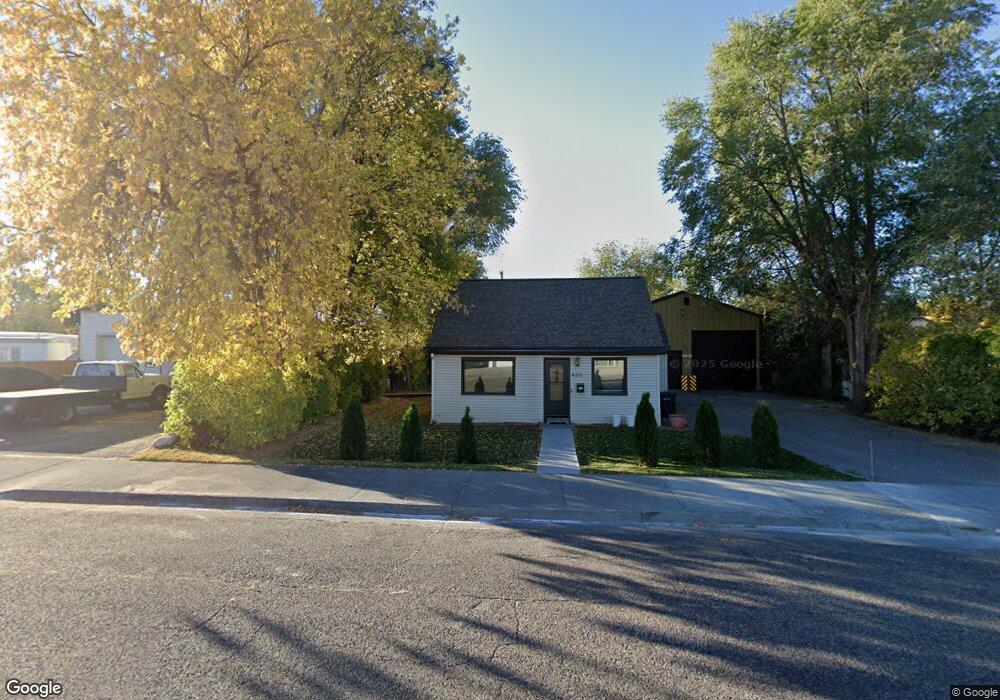
430 May St Idaho Falls, ID 83401
Estimated Value: $220,000 - $261,815
2
Beds
1
Bath
1,232
Sq Ft
$198/Sq Ft
Est. Value
About This Home
This home is located at 430 May St, Idaho Falls, ID 83401 and is currently estimated at $243,454, approximately $197 per square foot. 430 May St is a home located in Bonneville County with nearby schools including Dora Erickson Elementary School, Taylorview Middle School, and Idaho Falls Senior High School.
Ownership History
Date
Name
Owned For
Owner Type
Purchase Details
Closed on
Nov 30, 2010
Sold by
Magnusson Jack D and Magnusson Zella Lavine
Bought by
Loosli Curtis and Loosli Marina L
Current Estimated Value
Home Financials for this Owner
Home Financials are based on the most recent Mortgage that was taken out on this home.
Original Mortgage
$68,000
Outstanding Balance
$44,728
Interest Rate
4.21%
Mortgage Type
Purchase Money Mortgage
Estimated Equity
$198,726
Create a Home Valuation Report for This Property
The Home Valuation Report is an in-depth analysis detailing your home's value as well as a comparison with similar homes in the area
Home Values in the Area
Average Home Value in this Area
Purchase History
| Date | Buyer | Sale Price | Title Company |
|---|---|---|---|
| Loosli Curtis | -- | -- |
Source: Public Records
Mortgage History
| Date | Status | Borrower | Loan Amount |
|---|---|---|---|
| Open | Loosli Curtis | $68,000 |
Source: Public Records
Tax History Compared to Growth
Tax History
| Year | Tax Paid | Tax Assessment Tax Assessment Total Assessment is a certain percentage of the fair market value that is determined by local assessors to be the total taxable value of land and additions on the property. | Land | Improvement |
|---|---|---|---|---|
| 2025 | $2,087 | $289,062 | $63,711 | $225,351 |
| 2024 | $2,087 | $256,754 | $43,927 | $212,827 |
| 2023 | $2,228 | $210,147 | $43,927 | $166,220 |
| 2022 | $2,283 | $161,223 | $30,033 | $131,190 |
| 2021 | $1,861 | $114,923 | $30,033 | $84,890 |
| 2019 | $1,790 | $97,486 | $25,036 | $72,450 |
| 2018 | $1,643 | $99,609 | $22,779 | $76,830 |
| 2017 | $1,525 | $86,676 | $16,566 | $70,110 |
| 2016 | $1,463 | $81,207 | $15,047 | $66,160 |
| 2015 | $1,441 | $76,427 | $15,047 | $61,380 |
| 2014 | $21,470 | $76,427 | $15,047 | $61,380 |
| 2013 | $1,441 | $78,887 | $15,047 | $63,840 |
Source: Public Records
Map
Nearby Homes