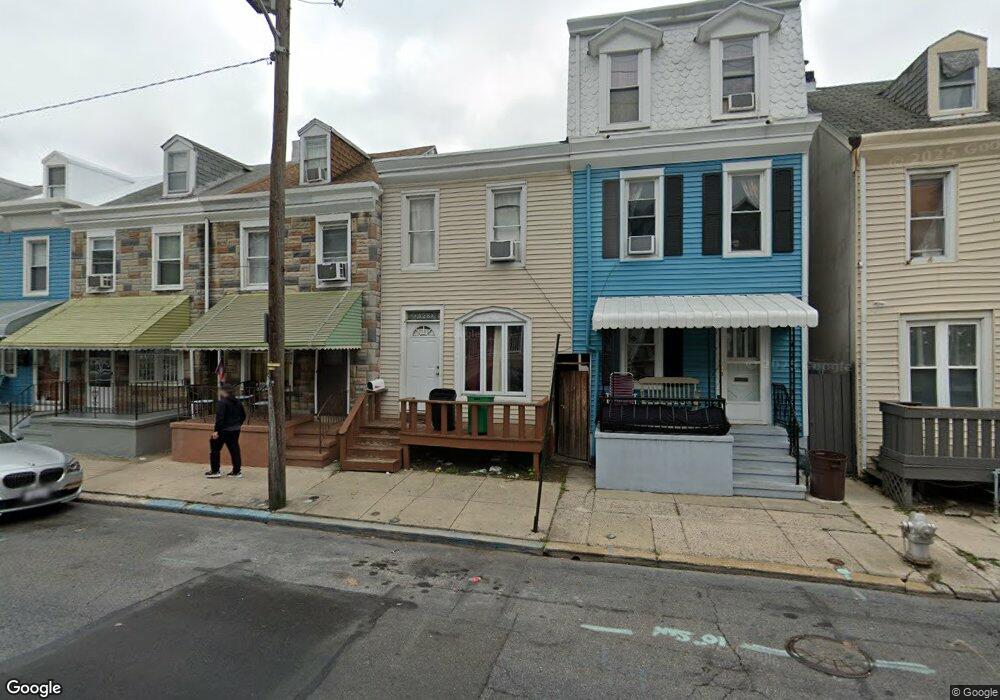
430 N 11th St Reading, PA 19604
Southeast Reading NeighborhoodEstimated Value: $153,659 - $222,000
5
Beds
1
Bath
1,416
Sq Ft
$132/Sq Ft
Est. Value
About This Home
This home is located at 430 N 11th St, Reading, PA 19604 and is currently estimated at $186,415, approximately $131 per square foot. 430 N 11th St is a home located in Berks County with nearby schools including Tenth & Green El School, Central Middle School, and Reading Senior High School.
Ownership History
Date
Name
Owned For
Owner Type
Purchase Details
Closed on
Dec 9, 2025
Sold by
Colindres Juan A and Colindres-Vega Juan Antonio
Bought by
Garcia Olga M
Current Estimated Value
Home Financials for this Owner
Home Financials are based on the most recent Mortgage that was taken out on this home.
Original Mortgage
$18,720
Outstanding Balance
$18,720
Interest Rate
6.24%
Mortgage Type
New Conventional
Estimated Equity
$167,695
Purchase Details
Closed on
Mar 25, 2003
Sold by
Community Initiatives Development Corp
Bought by
Colindres Juan A
Home Financials for this Owner
Home Financials are based on the most recent Mortgage that was taken out on this home.
Original Mortgage
$45,550
Interest Rate
5.75%
Purchase Details
Closed on
Feb 12, 2001
Sold by
Miller Susan M
Bought by
Community Initiatives Development Corp
Create a Home Valuation Report for This Property
The Home Valuation Report is an in-depth analysis detailing your home's value as well as a comparison with similar homes in the area
Home Values in the Area
Average Home Value in this Area
Purchase History
| Date | Buyer | Sale Price | Title Company |
|---|---|---|---|
| Garcia Olga M | -- | None Listed On Document | |
| Colindres Juan A | $47,000 | Chicago Title Insurance Co | |
| Community Initiatives Development Corp | $9,500 | -- |
Source: Public Records
Mortgage History
| Date | Status | Borrower | Loan Amount |
|---|---|---|---|
| Open | Garcia Olga M | $18,720 | |
| Previous Owner | Colindres Juan A | $45,550 |
Source: Public Records
Tax History
| Year | Tax Paid | Tax Assessment Tax Assessment Total Assessment is a certain percentage of the fair market value that is determined by local assessors to be the total taxable value of land and additions on the property. | Land | Improvement |
|---|---|---|---|---|
| 2025 | $1,197 | $44,100 | $12,000 | $32,100 |
| 2024 | $1,958 | $44,100 | $12,000 | $32,100 |
| 2023 | $1,928 | $44,100 | $12,000 | $32,100 |
| 2022 | $1,928 | $44,100 | $12,000 | $32,100 |
| 2021 | $1,928 | $44,100 | $12,000 | $32,100 |
| 2020 | $1,908 | $44,100 | $12,000 | $32,100 |
| 2019 | $1,908 | $44,100 | $12,000 | $32,100 |
| 2018 | $1,908 | $44,100 | $12,000 | $32,100 |
| 2017 | $1,896 | $44,100 | $12,000 | $32,100 |
| 2016 | $1,083 | $44,100 | $12,000 | $32,100 |
| 2015 | $1,083 | $44,100 | $12,000 | $32,100 |
| 2014 | $997 | $44,100 | $12,000 | $32,100 |
Source: Public Records
Map
Nearby Homes