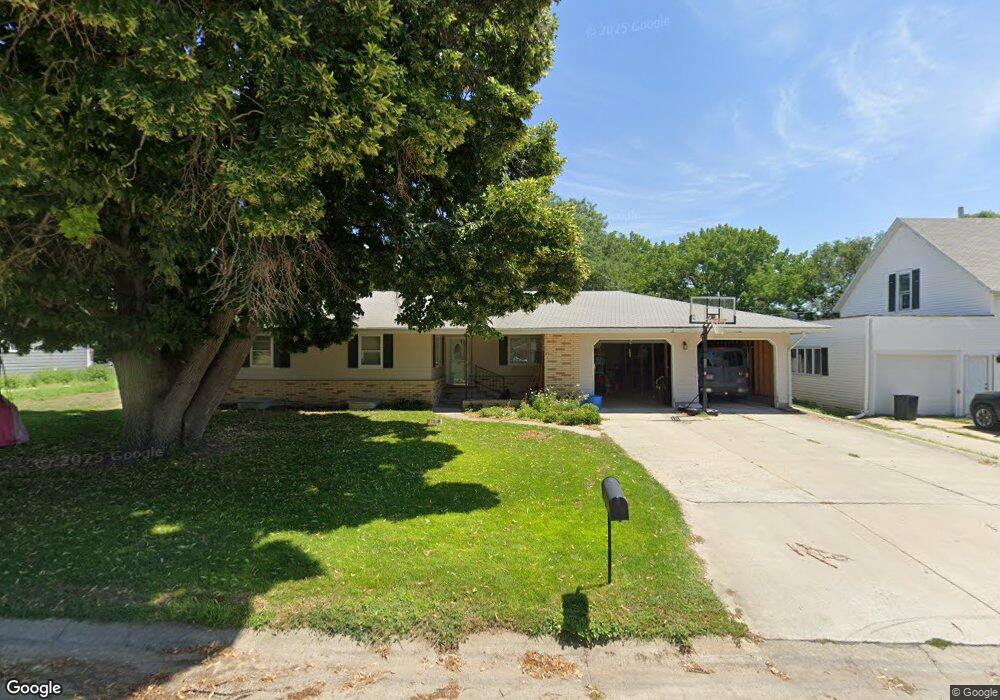
430 N 15th Ave Broken Bow, NE 68822
Estimated Value: $172,000 - $217,000
Studio
--
Bath
1,254
Sq Ft
$162/Sq Ft
Est. Value
About This Home
This home is located at 430 N 15th Ave, Broken Bow, NE 68822 and is currently estimated at $203,244, approximately $162 per square foot. 430 N 15th Ave is a home with nearby schools including North Park Elementary School, Broken Bow Junior High School, and Broken Bow High School.
Ownership History
Date
Name
Owned For
Owner Type
Purchase Details
Closed on
Nov 7, 2025
Sold by
Jensen Tyce E & Bethany L
Bought by
Bates Keli W
Current Estimated Value
Home Financials for this Owner
Home Financials are based on the most recent Mortgage that was taken out on this home.
Original Mortgage
$180,000
Outstanding Balance
$173,766
Interest Rate
0.55%
Mortgage Type
New Conventional
Estimated Equity
$29,478
Purchase Details
Closed on
Jun 2, 2014
Sold by
White Connie K
Bought by
Jensen Tyce E & Bethany L
Purchase Details
Closed on
May 21, 2014
Sold by
White Dennis F and White Wife
Bought by
White Connie K
Create a Home Valuation Report for This Property
The Home Valuation Report is an in-depth analysis detailing your home's value as well as a comparison with similar homes in the area
Home Values in the Area
Average Home Value in this Area
Purchase History
| Date | Buyer | Sale Price | Title Company |
|---|---|---|---|
| Bates Keli W | $237,156 | Tri City Title | |
| Jensen Tyce E & Bethany L | $124,900 | -- | |
| White Connie K | -- | -- |
Source: Public Records
Mortgage History
| Date | Status | Borrower | Loan Amount |
|---|---|---|---|
| Open | Bates Keli W | $180,000 |
Source: Public Records
Tax History
| Year | Tax Paid | Tax Assessment Tax Assessment Total Assessment is a certain percentage of the fair market value that is determined by local assessors to be the total taxable value of land and additions on the property. | Land | Improvement |
|---|---|---|---|---|
| 2025 | $2,625 | $205,503 | $16,621 | $188,882 |
| 2024 | $2,321 | $170,087 | $16,621 | $153,466 |
| 2023 | $2,472 | $157,831 | $16,621 | $141,210 |
| 2022 | $2,512 | $136,901 | $16,621 | $120,280 |
| 2021 | $2,437 | $135,862 | $15,582 | $120,280 |
| 2020 | $2,416 | $135,862 | $15,582 | $120,280 |
| 2019 | $2,221 | $125,093 | $7,776 | $117,317 |
| 2017 | $2,283 | $125,042 | $7,776 | $117,266 |
| 2016 | $2,439 | $122,035 | $4,769 | $117,266 |
| 2015 | $1,923 | $95,413 | $4,675 | $90,738 |
| 2014 | $1,923 | $86,739 | $4,250 | $82,489 |
Source: Public Records
Map
Nearby Homes
Your Personal Tour Guide
Ask me questions while you tour the home.