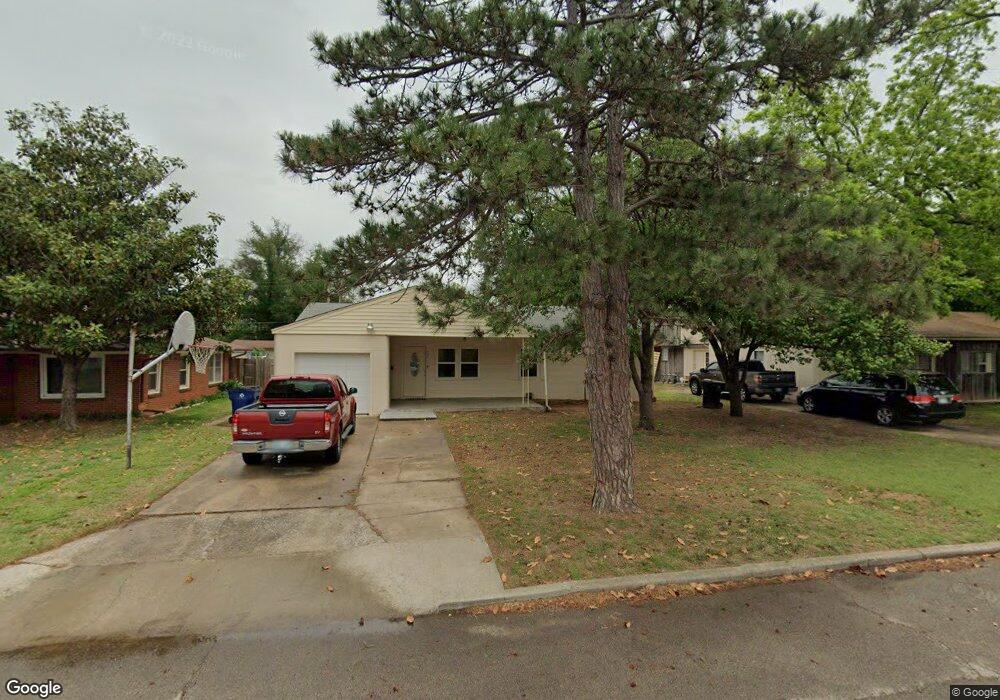
430 N 21st St Duncan, OK 73533
Estimated Value: $121,000 - $140,000
3
Beds
2
Baths
1,228
Sq Ft
$108/Sq Ft
Est. Value
About This Home
This home is located at 430 N 21st St, Duncan, OK 73533 and is currently estimated at $133,006, approximately $108 per square foot. 430 N 21st St is a home located in Stephens County with nearby schools including Horace Mann Elementary School, Duncan Middle School, and Duncan High School.
Ownership History
Date
Name
Owned For
Owner Type
Purchase Details
Closed on
Sep 16, 2024
Sold by
Mcgee Hadassah Joy
Bought by
Riley Andrew G
Current Estimated Value
Home Financials for this Owner
Home Financials are based on the most recent Mortgage that was taken out on this home.
Original Mortgage
$126,100
Outstanding Balance
$124,634
Interest Rate
6.73%
Mortgage Type
New Conventional
Estimated Equity
$8,372
Purchase Details
Closed on
Jul 7, 2020
Sold by
Tugman Donald M
Bought by
Smith Ronnie G and Smith Betty R
Purchase Details
Closed on
Oct 18, 2013
Sold by
Huho Ladonna G
Bought by
Tugman Donald M
Purchase Details
Closed on
Jun 6, 2005
Sold by
Hutto Timothy M
Bought by
Hutto Ladonna G
Purchase Details
Closed on
Mar 21, 2002
Sold by
Daniel Joy C and Daniel Noel C
Purchase Details
Closed on
Apr 10, 2000
Sold by
Legg Joy C
Create a Home Valuation Report for This Property
The Home Valuation Report is an in-depth analysis detailing your home's value as well as a comparison with similar homes in the area
Home Values in the Area
Average Home Value in this Area
Purchase History
| Date | Buyer | Sale Price | Title Company |
|---|---|---|---|
| Riley Andrew G | $130,000 | First American Title | |
| Smith Ronnie G | $33,000 | None Available | |
| Tugman Donald M | -- | American First Title & Trust | |
| Hutto Ladonna G | -- | None Available | |
| -- | $46,000 | -- | |
| -- | -- | -- |
Source: Public Records
Mortgage History
| Date | Status | Borrower | Loan Amount |
|---|---|---|---|
| Open | Riley Andrew G | $126,100 |
Source: Public Records
Tax History Compared to Growth
Tax History
| Year | Tax Paid | Tax Assessment Tax Assessment Total Assessment is a certain percentage of the fair market value that is determined by local assessors to be the total taxable value of land and additions on the property. | Land | Improvement |
|---|---|---|---|---|
| 2025 | $1,130 | $14,391 | $879 | $13,512 |
| 2024 | $1,003 | $11,772 | $879 | $10,893 |
| 2023 | $1,003 | $11,728 | $879 | $10,849 |
| 2022 | $328 | $7,089 | $879 | $6,210 |
| 2021 | $312 | $3,669 | $879 | $2,790 |
| 2020 | $395 | $4,577 | $879 | $3,698 |
| 2019 | $387 | $4,470 | $879 | $3,591 |
| 2018 | $408 | $4,576 | $879 | $3,697 |
| 2017 | $505 | $5,881 | $879 | $5,002 |
| 2016 | $521 | $6,133 | $879 | $5,254 |
| 2015 | $507 | $6,133 | $879 | $5,254 |
| 2014 | $507 | $6,133 | $879 | $5,254 |
Source: Public Records
Map
Nearby Homes
- 2210 Western Dr
- 507 N Alice Dr
- 209 N 22nd St
- 2206 W Spruce Ave
- 2011 W Oak Ave
- 2006 W Oak Ave
- 2204 W Parkview Ave
- 174831 N 2844 Rd
- 1099 N 19th St
- 201 N 23rd St
- 1902 W Randall Ave
- 1807 W Chisholm Dr
- 2110 W Main St
- 123 N Highway 81
- 1212 N 21st St
- 206 N 28th St
- 1312 W Pine Ave
- 815 N 14th St
- 1309 W Beech Ave
- 1309 Whisenant Ct