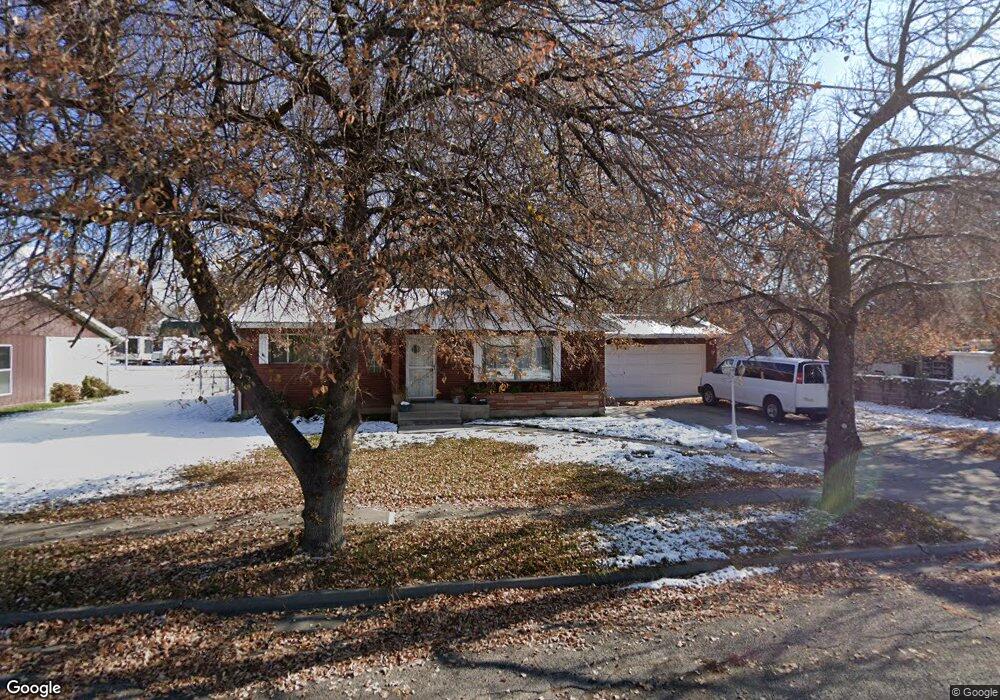
430 N 300 W American Fork, UT 84003
Estimated Value: $485,000 - $538,000
4
Beds
1
Bath
2,262
Sq Ft
$230/Sq Ft
Est. Value
About This Home
This home is located at 430 N 300 W, American Fork, UT 84003 and is currently estimated at $520,682, approximately $230 per square foot. 430 N 300 W is a home located in Utah County with nearby schools including Shelley Elementary School, American Fork Junior High School, and American Fork High School.
Ownership History
Date
Name
Owned For
Owner Type
Purchase Details
Closed on
Sep 18, 2014
Sold by
Durrant Diane P and Succo Jolene P
Bought by
Wilkinson Trina B and Wilkinson Daniel R
Current Estimated Value
Home Financials for this Owner
Home Financials are based on the most recent Mortgage that was taken out on this home.
Original Mortgage
$209,000
Outstanding Balance
$159,588
Interest Rate
4.07%
Mortgage Type
New Conventional
Estimated Equity
$361,094
Purchase Details
Closed on
Oct 20, 2000
Sold by
Parker Donna G
Bought by
Parker Donna G
Create a Home Valuation Report for This Property
The Home Valuation Report is an in-depth analysis detailing your home's value as well as a comparison with similar homes in the area
Home Values in the Area
Average Home Value in this Area
Purchase History
| Date | Buyer | Sale Price | Title Company |
|---|---|---|---|
| Wilkinson Trina B | -- | Keystone Title Ins Agen | |
| Parker Donna G | -- | -- |
Source: Public Records
Mortgage History
| Date | Status | Borrower | Loan Amount |
|---|---|---|---|
| Open | Wilkinson Trina B | $209,000 |
Source: Public Records
Tax History Compared to Growth
Tax History
| Year | Tax Paid | Tax Assessment Tax Assessment Total Assessment is a certain percentage of the fair market value that is determined by local assessors to be the total taxable value of land and additions on the property. | Land | Improvement |
|---|---|---|---|---|
| 2025 | $2,006 | $249,425 | $227,500 | $226,000 |
| 2024 | $2,006 | $222,915 | $0 | $0 |
| 2023 | $1,880 | $221,485 | $0 | $0 |
| 2022 | $2,094 | $243,485 | $0 | $0 |
| 2021 | $1,786 | $324,300 | $163,300 | $161,000 |
| 2020 | $1,667 | $293,500 | $145,800 | $147,700 |
| 2019 | $1,497 | $272,700 | $125,000 | $147,700 |
| 2018 | $1,383 | $240,900 | $112,500 | $128,400 |
| 2017 | $1,339 | $125,895 | $0 | $0 |
| 2016 | $1,265 | $110,440 | $0 | $0 |
| 2015 | $1,247 | $103,345 | $0 | $0 |
| 2014 | -- | $93,280 | $0 | $0 |
Source: Public Records
Map
Nearby Homes
- 540 N 300 W
- 365 N 100 W
- 356 N 480 W
- 641 N 420 W
- 370 W Pacific Dr Unit 1
- 621 N 100 W
- 399 W Pacific Dr
- 374 N Center St
- 782 N 200 W
- 796 N 200 W
- 105 N 100 W
- 129 W Pacific Dr
- 120 N 350 W Unit 127
- 120 N 350 W Unit 133
- 120 N 350 W Unit 130
- 414 N 100 E
- 396 N 100 E
- 914 N 400 W Unit A
- 183 E 760 St N
- 3889 W 950 Cir N Unit 366