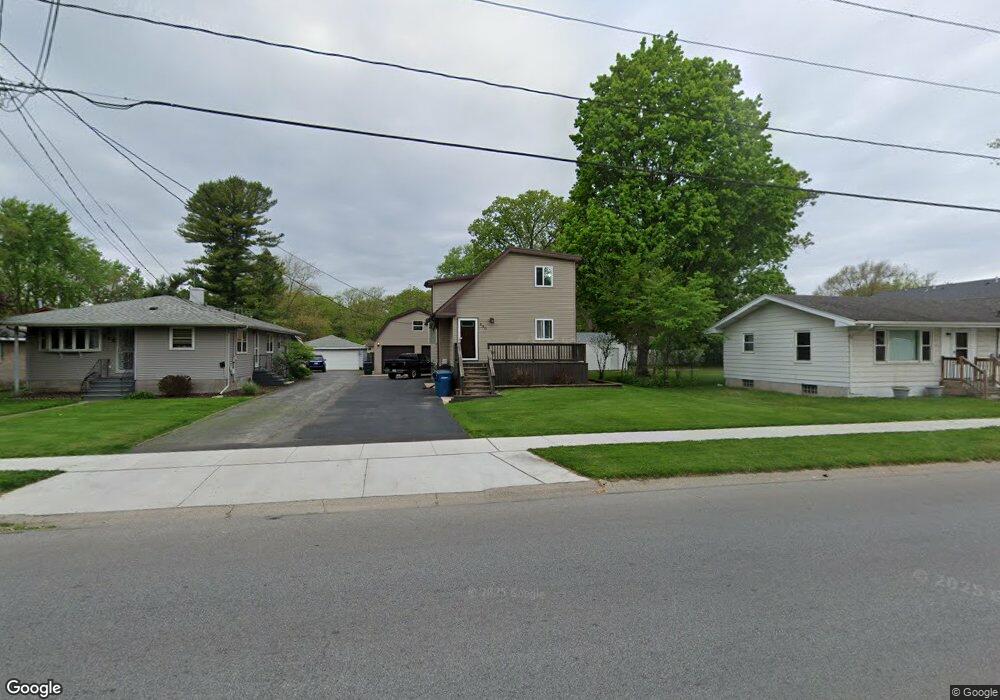
430 N Colfax St Griffith, IN 46319
Estimated Value: $252,000 - $331,000
3
Beds
2
Baths
1,694
Sq Ft
$171/Sq Ft
Est. Value
About This Home
This home is located at 430 N Colfax St, Griffith, IN 46319 and is currently estimated at $289,813, approximately $171 per square foot. 430 N Colfax St is a home located in Lake County with nearby schools including Griffith Senior High School, St Mary School, and Calumet Christian School.
Ownership History
Date
Name
Owned For
Owner Type
Purchase Details
Closed on
Mar 26, 2021
Sold by
Steinkamp John and Kurgan Chadd
Bought by
Kurgan Chadd
Current Estimated Value
Home Financials for this Owner
Home Financials are based on the most recent Mortgage that was taken out on this home.
Original Mortgage
$156,500
Outstanding Balance
$140,191
Interest Rate
3.05%
Mortgage Type
New Conventional
Estimated Equity
$149,622
Purchase Details
Closed on
May 17, 2019
Sold by
Kuroad Chrod
Bought by
Chrod Steinkanp John and Chrod Kurgan
Purchase Details
Closed on
Nov 17, 2016
Sold by
Stelkar John P
Bought by
Kuruam Chado
Purchase Details
Closed on
Mar 10, 2006
Sold by
Fifth Third Mortgage Co
Bought by
Federal Home Loan Mortgage Corporation
Purchase Details
Closed on
Feb 3, 2006
Sold by
Duggins Jason M
Bought by
Fifth Third Mortgage Co
Create a Home Valuation Report for This Property
The Home Valuation Report is an in-depth analysis detailing your home's value as well as a comparison with similar homes in the area
Home Values in the Area
Average Home Value in this Area
Purchase History
| Date | Buyer | Sale Price | Title Company |
|---|---|---|---|
| Kurgan Chadd | -- | Ravenswood Title Co | |
| Chrod Steinkanp John | -- | None Available | |
| Kuruam Chado | -- | None Available | |
| Federal Home Loan Mortgage Corporation | -- | None Available | |
| Fifth Third Mortgage Co | $108,272 | None Available |
Source: Public Records
Mortgage History
| Date | Status | Borrower | Loan Amount |
|---|---|---|---|
| Open | Kurgan Chadd | $156,500 |
Source: Public Records
Tax History
| Year | Tax Paid | Tax Assessment Tax Assessment Total Assessment is a certain percentage of the fair market value that is determined by local assessors to be the total taxable value of land and additions on the property. | Land | Improvement |
|---|---|---|---|---|
| 2025 | $3,161 | $298,700 | $31,700 | $267,000 |
| 2024 | $8,611 | $277,500 | $31,700 | $245,800 |
| 2023 | $3,116 | $262,900 | $31,700 | $231,200 |
| 2022 | $2,878 | $247,000 | $31,700 | $215,300 |
| 2021 | $1,983 | $199,900 | $34,400 | $165,500 |
| 2020 | $1,963 | $198,200 | $34,400 | $163,800 |
| 2019 | $1,883 | $186,100 | $28,900 | $157,200 |
| 2018 | $3,921 | $158,800 | $27,500 | $131,300 |
| 2017 | $4,376 | $162,400 | $27,500 | $134,900 |
| 2016 | $2,296 | $162,600 | $27,500 | $135,100 |
| 2014 | $4,480 | $153,500 | $27,500 | $126,000 |
| 2013 | $2,184 | $148,400 | $27,500 | $120,900 |
Source: Public Records
Map
Nearby Homes
- 644 N Glenwood St
- 706 N Colfax St
- 703 N Glenwood Ave
- 310 N Jay St
- 722 N Oakwood St
- 736 N Glenwood Ave
- 225 N Dwiggins St
- 141 N Dwiggins St
- 238 N Indiana St
- 906 E Glen Park Ave
- 719 N Indiana St
- 139 N Indiana St
- 338 N Lafayette St
- 415 N Wood St
- 1703 S Fairbanks St
- 902 N Wood St
- 5420 W 45th St
- 747 N Lafayette St
- 937 N Wood St
- 405 N Griffith Blvd
- 426 N Colfax St
- 438 N Colfax St
- 420 N Colfax St
- 1209 E Elm St
- 1203 E Elm St
- 1215 E Elm St
- 422 N Colfax St
- 416-12 N Colfax St
- 439 N Glenwood Dr
- 435 N Glenwood Dr
- 429 N Glenwood Dr
- 435 N Colfax St
- 443 N Glenwood Dr
- 425 N Glenwood Dr
- 425 N Colfax St
- 431 Colfax St
- 1305 E Elm St
- 417 N Colfax St
- 417 N Glenwood Dr
- 1210 E Elm St
Your Personal Tour Guide
Ask me questions while you tour the home.