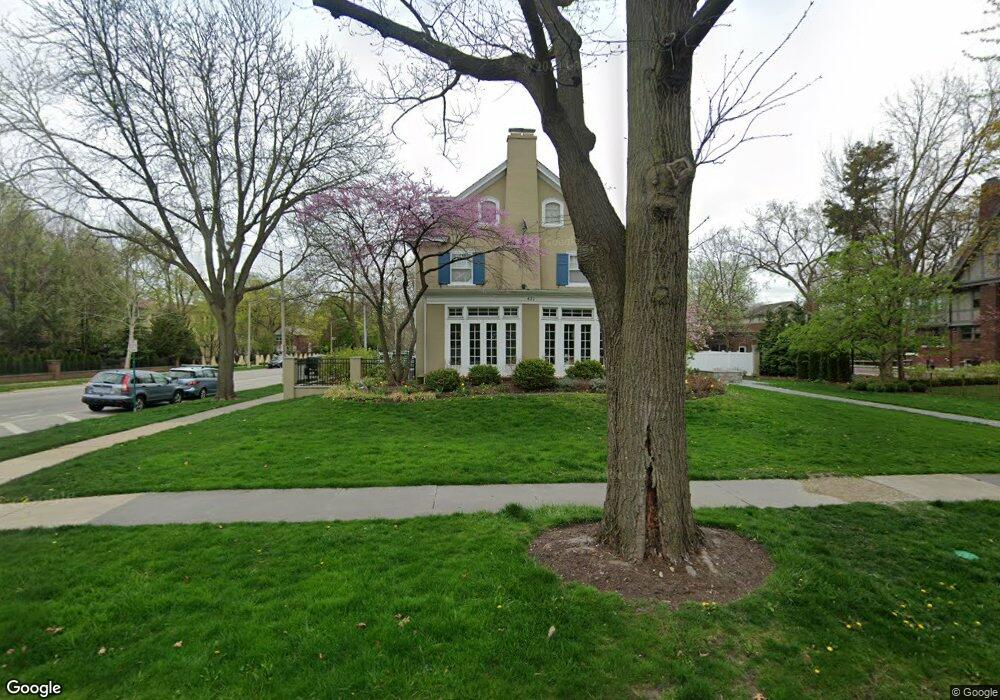
430 N Euclid Ave Oak Park, IL 60302
Estimated Value: $1,200,000 - $1,581,000
5
Beds
5
Baths
4,000
Sq Ft
$363/Sq Ft
Est. Value
About This Home
This home is located at 430 N Euclid Ave, Oak Park, IL 60302 and is currently estimated at $1,452,795, approximately $363 per square foot. 430 N Euclid Ave is a home located in Cook County with nearby schools including Oliver W Holmes Elementary School, Gwendolyn Brooks Middle School, and Oak Park and River Forest High School.
Ownership History
Date
Name
Owned For
Owner Type
Purchase Details
Closed on
Aug 25, 2009
Sold by
Gancer John and Gancer Susan
Bought by
Savage Chad Michael and Savage Regina Lawrence
Current Estimated Value
Home Financials for this Owner
Home Financials are based on the most recent Mortgage that was taken out on this home.
Original Mortgage
$768,000
Outstanding Balance
$502,524
Interest Rate
5.2%
Mortgage Type
New Conventional
Estimated Equity
$950,271
Purchase Details
Closed on
Nov 30, 1998
Sold by
Jenzen Catherine M and Kipnis Catherine Diana
Bought by
Gancer John and Gancer Susan
Home Financials for this Owner
Home Financials are based on the most recent Mortgage that was taken out on this home.
Original Mortgage
$360,000
Interest Rate
7%
Create a Home Valuation Report for This Property
The Home Valuation Report is an in-depth analysis detailing your home's value as well as a comparison with similar homes in the area
Home Values in the Area
Average Home Value in this Area
Purchase History
| Date | Buyer | Sale Price | Title Company |
|---|---|---|---|
| Savage Chad Michael | $960,000 | Prairie Title | |
| Gancer John | -- | Chicago Title Insurance Co | |
| Gancer John | $157,500 | -- |
Source: Public Records
Mortgage History
| Date | Status | Borrower | Loan Amount |
|---|---|---|---|
| Open | Savage Chad Michael | $768,000 | |
| Previous Owner | Gancer John | $360,000 |
Source: Public Records
Tax History Compared to Growth
Tax History
| Year | Tax Paid | Tax Assessment Tax Assessment Total Assessment is a certain percentage of the fair market value that is determined by local assessors to be the total taxable value of land and additions on the property. | Land | Improvement |
|---|---|---|---|---|
| 2024 | $34,127 | $108,000 | $24,640 | $83,360 |
| 2023 | $36,236 | $108,000 | $24,640 | $83,360 |
| 2022 | $36,236 | $97,785 | $18,480 | $79,305 |
| 2021 | $35,345 | $97,785 | $18,480 | $79,305 |
| 2020 | $34,564 | $97,785 | $18,480 | $79,305 |
| 2019 | $37,072 | $100,056 | $16,720 | $83,336 |
| 2018 | $35,680 | $100,056 | $16,720 | $83,336 |
| 2017 | $34,919 | $100,056 | $16,720 | $83,336 |
| 2016 | $34,905 | $89,220 | $14,080 | $75,140 |
| 2015 | $31,229 | $89,220 | $14,080 | $75,140 |
| 2014 | $31,161 | $95,557 | $14,080 | $81,477 |
| 2013 | $29,176 | $92,279 | $14,080 | $78,199 |
Source: Public Records
Map
Nearby Homes
- 212 N Oak Park Ave Unit 2EE
- 222 N Grove Ave Unit 2B
- 224 N Kenilworth Ave Unit 4D
- 221 N Kenilworth Ave Unit 105
- 330 N Ridgeland Ave
- 203 N Kenilworth Ave Unit 2N
- 203 N Kenilworth Ave Unit 2P
- 806 N Grove Ave
- 163 N Cuyler Ave
- 1038 Superior St Unit 1W
- 420 N Marion St
- 253 Ontario St
- 217 Chicago Ave Unit 3
- 828 N Ridgeland Ave
- 120 Chicago Ave Unit A
- 845 Pleasant St Unit 3E
- 845 Pleasant St Unit 2E
- 1009 N Oak Park Ave
- 742 N Marion St
- 62 Chicago Ave
- 500 N Euclid Ave
- 431 Linden Ave
- 420 N Euclid Ave
- 425 Linden Ave
- 506 N Euclid Ave
- 431 N Euclid Ave
- 501 Linden Ave
- 415 Linden Ave
- 510 N Euclid Ave
- 511 Linden Ave
- 507 N Euclid Ave
- 427 N Euclid Ave
- 427 N Euclid Ave
- 710 Chicago Ave
- 517 N Euclid Ave
- 401 Linden Ave
- 522 N Euclid Ave
- 424 Linden Ave
- 424 Linden Ave
- 440 Linden Ave