Estimated Value: $163,043 - $215,000
3
Beds
3
Baths
1,317
Sq Ft
$146/Sq Ft
Est. Value
About This Home
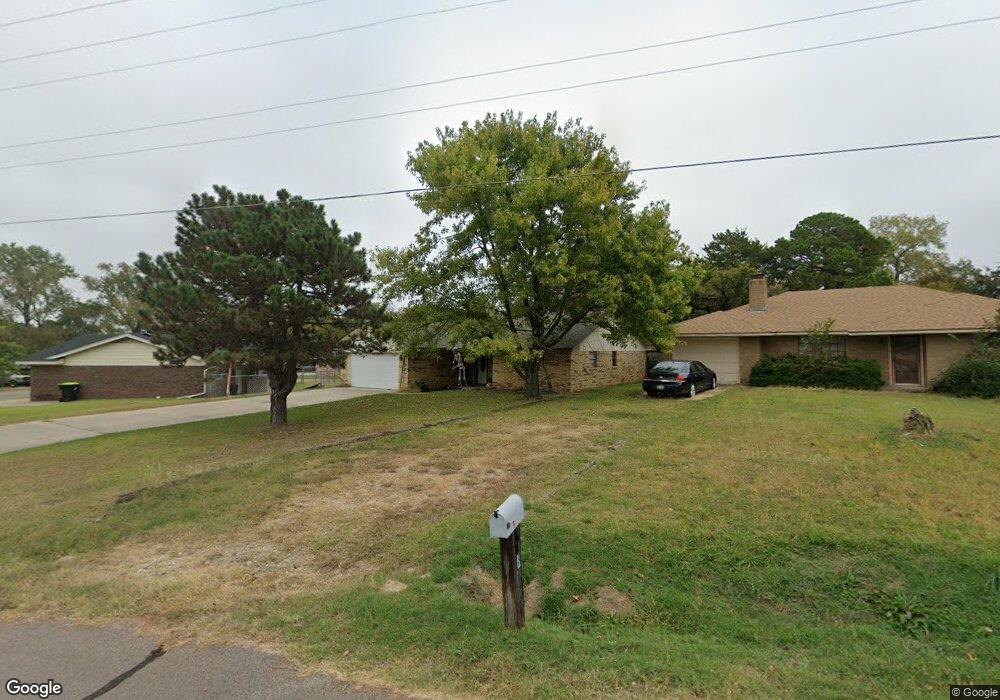
This home is located at 430 N Hillcrest St, Ada, OK 74820 and is currently estimated at $191,761, approximately $145 per square foot. 430 N Hillcrest St is a home located in Pontotoc County with nearby schools including Byng Junior High School and Byng High School.
Ownership History
Date
Name
Owned For
Owner Type
Purchase Details
Closed on
Jul 23, 2012
Sold by
Arvest Trust Co Na
Bought by
Equity Trust Company and Cheryl Magoteaux Simple Ira
Current Estimated Value
Purchase Details
Closed on
Aug 29, 2011
Sold by
Crittenden Gary N and Crittenden Pauline
Bought by
Arvest Trust Co Na and Cheryl Magoteaux Simple Ira
Purchase Details
Closed on
Mar 14, 2008
Sold by
Johnson Dustin and Johnson Angela M
Bought by
Crittenden Gary N and Crittenden Paulline
Home Financials for this Owner
Home Financials are based on the most recent Mortgage that was taken out on this home.
Original Mortgage
$84,000
Interest Rate
5.72%
Mortgage Type
New Conventional
Purchase Details
Closed on
Aug 20, 2003
Sold by
Laura Herrmann
Bought by
Dustin Dustin J and Dustin Johnson
Purchase Details
Closed on
Feb 23, 2001
Sold by
Jequeta Paul and Jequeta Keithley
Bought by
Laura Raymond and Laura Herrmann
Purchase Details
Closed on
Mar 24, 1993
Sold by
C and D
Bought by
Jequeta Paul and Jequeta Keithley
Create a Home Valuation Report for This Property
The Home Valuation Report is an in-depth analysis detailing your home's value as well as a comparison with similar homes in the area
Purchase History
| Date | Buyer | Sale Price | Title Company |
|---|---|---|---|
| Equity Trust Company | -- | None Available | |
| Arvest Trust Co Na | $115,000 | None Available | |
| Crittenden Gary N | $105,000 | None Available | |
| Dustin Dustin J | $77,500 | -- | |
| Laura Raymond | $74,000 | -- | |
| Jequeta Paul | $48,000 | -- |
Source: Public Records
Mortgage History
| Date | Status | Borrower | Loan Amount |
|---|---|---|---|
| Previous Owner | Crittenden Gary N | $84,000 |
Source: Public Records
Tax History
| Year | Tax Paid | Tax Assessment Tax Assessment Total Assessment is a certain percentage of the fair market value that is determined by local assessors to be the total taxable value of land and additions on the property. | Land | Improvement |
|---|---|---|---|---|
| 2025 | $1,478 | $16,348 | $2,205 | $14,143 |
| 2024 | $1,408 | $15,569 | $2,100 | $13,469 |
| 2023 | $1,408 | $14,828 | $2,100 | $12,728 |
| 2022 | $1,113 | $14,122 | $2,100 | $12,022 |
| 2021 | $1,122 | $14,122 | $2,100 | $12,022 |
| 2020 | $1,134 | $14,122 | $2,100 | $12,022 |
| 2019 | $1,162 | $14,362 | $2,100 | $12,262 |
| 2018 | $1,163 | $14,843 | $2,100 | $12,743 |
| 2017 | $1,167 | $15,083 | $2,100 | $12,983 |
| 2016 | $1,172 | $15,049 | $1,000 | $14,049 |
| 2015 | $1,146 | $14,332 | $1,000 | $13,332 |
| 2014 | -- | $13,650 | $1,000 | $12,650 |
Source: Public Records
Map
Nearby Homes
- 0 Arlington Blvd
- 2731 E 7th St
- 2627 Woodland Dr
- 2807 Arlington St
- 605 Ann Ave
- 2217 E Meandering Way
- 2501 Timber Terrace
- 2507 Timber Terrace
- 2819 Abbey Dr
- 0 N Wolfe Ln
- 1319 N Wolfe Ln
- 2431 Foliage Dr
- 2909 E Corona St
- 2005 E Foster Dr
- 825 N Summer Tree Dr
- 1201 Emily Ln
- 1210 N Wolfe Ln
- 1928 Arlington St
- 520 N Crownpoint Dr
- 1914 E Arlington St
- 2601 Arlington St Unit 3
- 426 N Hillcrest St
- 2615 Arlington Blvd
- 424 N Hillcrest St
- 2601 Arlington Blvd
- 2601 Arlington Blvd Unit 3
- 2621 Arlington Blvd
- 422 N Hillcrest St
- 515 N Hillcrest St
- 429 N Hillcrest St
- 2626 Arlington Blvd
- 2606 Arlington Blvd
- 503 Price St
- 420 N Hillcrest St
- 2528 Arlington Blvd
- 501 Price St
- 507 Price St
- 2616 Arlington Blvd
- 423 N Hillcrest St
- 2725 E 7th St
Your Personal Tour Guide
Ask me questions while you tour the home.