Estimated Value: $106,117
--
Bed
--
Bath
--
Sq Ft
7,797
Sq Ft Lot
About This Home
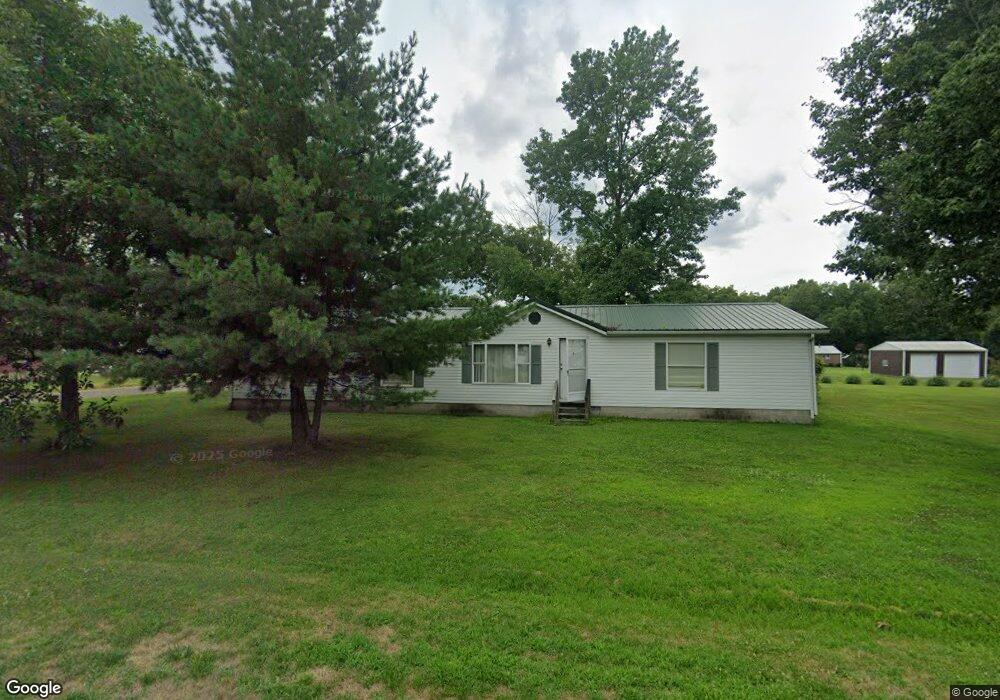
This home is located at 430 N Main St, Xenia, IL 62899 and is currently estimated at $106,117. 430 N Main St is a home with nearby schools including Flora Elementary School and Flora High School.
Ownership History
Date
Name
Owned For
Owner Type
Purchase Details
Closed on
Jun 30, 2021
Sold by
Tackitt Samuel J
Bought by
Wathan James N
Current Estimated Value
Home Financials for this Owner
Home Financials are based on the most recent Mortgage that was taken out on this home.
Original Mortgage
$78,551
Outstanding Balance
$71,273
Interest Rate
2.9%
Mortgage Type
FHA
Estimated Equity
$34,844
Purchase Details
Closed on
Aug 30, 2010
Sold by
Edgington Dustin
Bought by
Tackitt Samuel J
Home Financials for this Owner
Home Financials are based on the most recent Mortgage that was taken out on this home.
Original Mortgage
$54,900
Interest Rate
4.6%
Mortgage Type
New Conventional
Purchase Details
Closed on
Jun 9, 2006
Sold by
Nation Samuel James and Nation Waynette
Bought by
Edgington Dustin
Home Financials for this Owner
Home Financials are based on the most recent Mortgage that was taken out on this home.
Original Mortgage
$55,000
Interest Rate
7%
Mortgage Type
Purchase Money Mortgage
Create a Home Valuation Report for This Property
The Home Valuation Report is an in-depth analysis detailing your home's value as well as a comparison with similar homes in the area
Home Values in the Area
Average Home Value in this Area
Purchase History
| Date | Buyer | Sale Price | Title Company |
|---|---|---|---|
| Wathan James N | $80,000 | None Available | |
| Tackitt Samuel J | $8,000 | None Available | |
| Edgington Dustin | $6,000 | None Available |
Source: Public Records
Mortgage History
| Date | Status | Borrower | Loan Amount |
|---|---|---|---|
| Open | Wathan James N | $78,551 | |
| Previous Owner | Tackitt Samuel J | $54,900 | |
| Previous Owner | Edgington Dustin | $55,000 |
Source: Public Records
Tax History Compared to Growth
Tax History
| Year | Tax Paid | Tax Assessment Tax Assessment Total Assessment is a certain percentage of the fair market value that is determined by local assessors to be the total taxable value of land and additions on the property. | Land | Improvement |
|---|---|---|---|---|
| 2024 | $2,029 | $32,092 | $829 | $31,263 |
| 2023 | $1,930 | $29,783 | $769 | $29,014 |
| 2022 | $1,747 | $26,457 | $686 | $25,771 |
| 2021 | $410 | $4,723 | $674 | $4,049 |
| 2020 | $398 | $4,533 | $647 | $3,886 |
| 2019 | $226 | $4,533 | $647 | $3,886 |
| 2018 | $231 | $4,685 | $623 | $4,062 |
| 2017 | $234 | $4,601 | $612 | $3,989 |
| 2016 | $236 | $4,438 | $590 | $3,848 |
| 2015 | $232 | $4,438 | $590 | $3,848 |
| 2013 | $227 | $4,304 | $575 | $3,729 |
| 2012 | $229 | $4,138 | $553 | $3,585 |
Source: Public Records
Map
Nearby Homes
- 326 N Main St
- 1718 County Road Hwy 13
- 115 West St
- 1934 County Road 315 E
- 000 Old Highway 50 Hwy
- 000 S Tallowtree Dr
- 000 E Tallowtree Dr
- 000 Beard Rd
- 5951 Beard Rd
- 000 Cherrybark Ln
- 2517 Cherrybark Ln
- 199 Hanging Rock Rd
- 000 E Coon Creek Ln
- 1682 W Coon Creek Ln
- 1682 E Coon Creek Ln
- 000 W Coon Creek Ln
- 0 Leaf Dr
- 108 Juneberry Dr
- 7847 Old Highway 50
- 8290 Old Highway 50